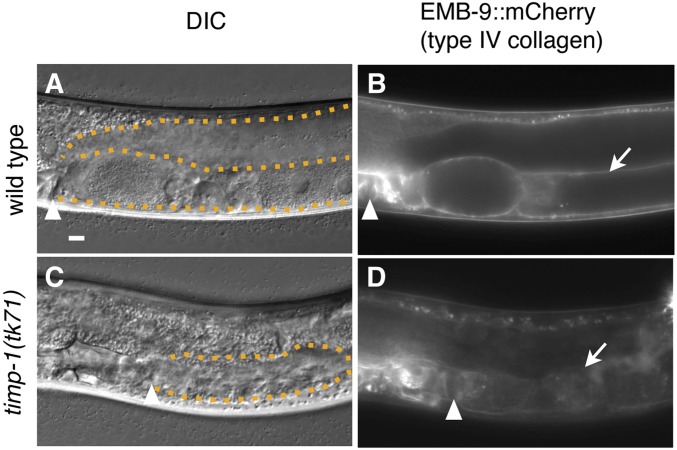
Figure 4.
EMB-9::mCherry localization on the gonadal basement membrane in the timp-1(tk71) mutant. DIC (A and C) and fluorescence (B and D) images of gonads in WT (A and B) and timp-1(tk71) (C and D) young adults with tkTi1[emb-9/type IV collagen α1 chain::mCherry]. The arrowheads in (A–D) indicate vulvae. The arrows in (B and D) indicate the gonadal basement membrane. The orange dotted lines outline the gonad in (A and C). The photographic exposure time was the same in (B and D). In all panels, the anterior region of the gonad is to the left and its dorsal region is at the top of the image. Bar, 10 μm.

