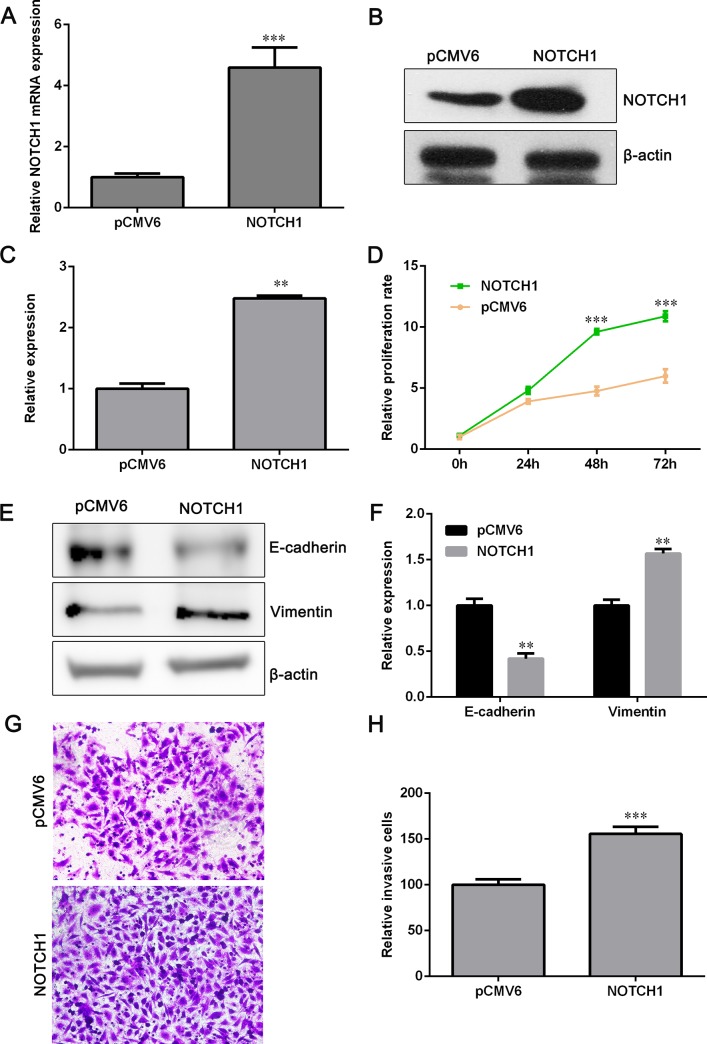
Fig 6. Overexpression of NOTCH1 promotes cell proliferation and invasion.
(A) NCI-H358 cells were transfected with NOTCH1 plasmids and the mRNA expression of NOTCH1 was determined with qPCR assay. (B) Western blot assay was performed to detect the expression of NOTCH1 after NCI-H358 cells were transfected with NOTCH1 plasmids. (C) Relative protein expression of NOTCH1 is shown. (D) Cell proliferation was detected by CCK-8 assay after NCI-H358 cells were transfected with NOTCH1 plasmids or pCMV6 vectors. (E) The protein level of E-cadherin and Vimentin was assessed by Western blot assay. (F) Relative protein expression of E-cadherin and Vimentin is shown. (G) Transwell assay was used to determine cell invasive ability. (H) Relative number of invaded cells is shown. Data are shown as mean ± SD (n = 3). **P<0.01 and ***P<0.001 versus the pCMV6 group.

