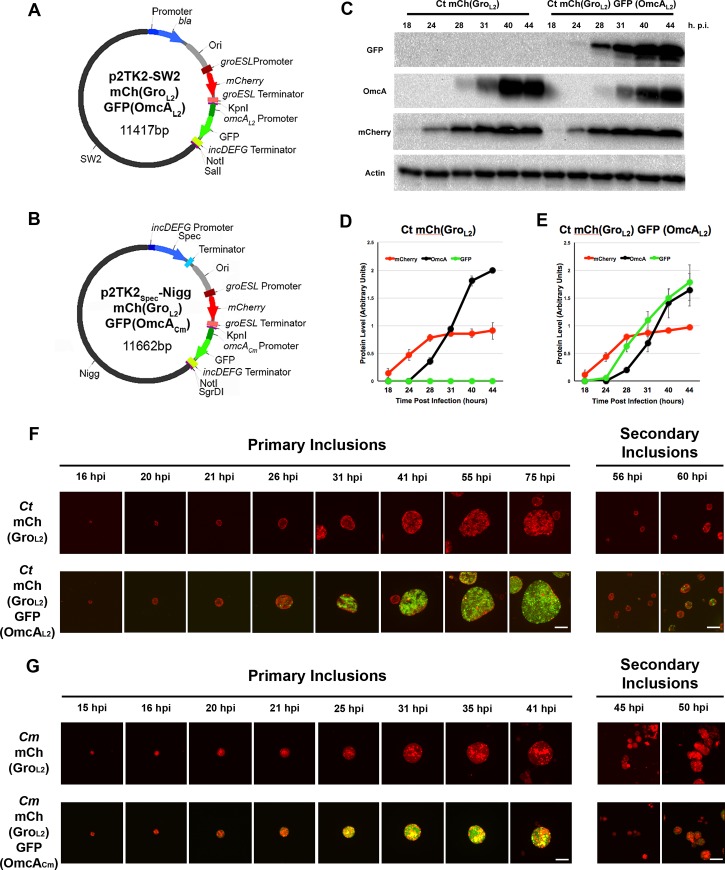
Fig 3. Transcriptional fluorescent reporters to monitor RB to EB transition in C. trachomatis and C. muridarum.
Vector maps of p2TK2-SW2 mCh(GroL2)GFP(OmcAL2) (A) and p2TK2-Nigg mCh(GroL2)GFP(OmcACm) (B). The pSW2 and pNigg plasmids are shown in black; the incDEFG promoter in dark blue; the spectinomycin resistance gene (aadA) and ampicillin resistance gene (bla) in blue; the terminator in light blue; the E. coli origin of replication (Ori) in grey; the groESL promoter in dark red; mCherry ORF in red; the groESL terminator in light red; the omcA promoter in dark green; GFP in green; the incDEFG terminator in light green; unique restriction sites in purple. (C) Immuno-blot of cell lysates from HeLa cells infected with a strain of C. trachomatis transformed with p2TK2Spec-SW2 mCh(GroL2) or p2TK2Spec-SW2 mCh(GroL2) GFP(OmcAL2). Lysates were collected at the indicated time and probed using antibodies against GFP, OmcA, mCherry, and actin. (D-E) Quantification of the signal intensity of the indicated marker from immunoblots as shown in (C). The average signal intensity from three independent experiments is shown. mCherry: red, OmcA: black and GFP: green. (F-G) Selected 3-dimensional merged frames from Video S1 (Top panels, (F)), Video S2 (Bottom panels, (F)), Video S3 (Top panels, (G)) and Video S4 (Bottom panels, (G)) acquired by time-lapse video confocal microscopy of HeLa cells infected with C. trachomatis (F) or C. muridarum (G) expressing mCherry (red) from the groESL promoter (Top panels) or mCherry (red) and GFP (green) under the control of the C. trachomatis groESL and omcA promoter, respectively (Bottom panels). Frames were selected to provide representative examples of primary (left) and secondary (right) inclusions. The time p.i. is indicated above each frame. Scale Bar: 10μm.

