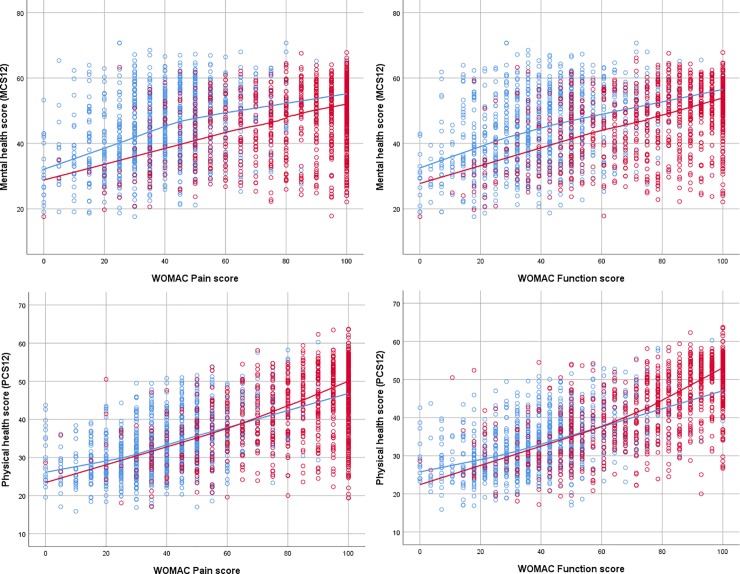
Fig 2.
Scatter-plots of the SF12 Mental Component Score (left) and Physical Component Score (right) as a function of the WOMAC Pain score (top) and WOMAC Function score (bottom), in patients with total hip arthroplasty, before surgery (blue circles) and one year after surgery red circles). Non-parametric regression lines are superimposed (before surgery: blue line, one year after surgery: red line).

