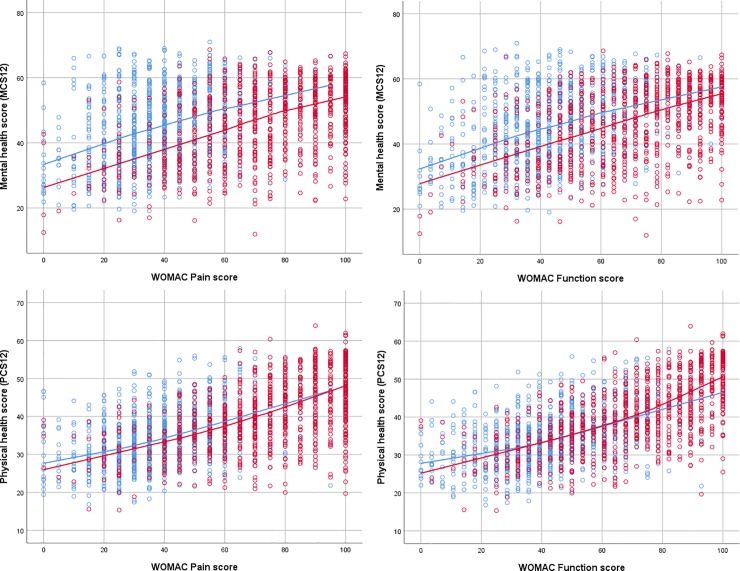
Fig 3.
Scatter-plots of the SF12 Mental Component Score (left) and the SF12 Physical Component Score (right) as a function of the WOMAC Pain score (top) and WOMAC Function score (bottom), in patients with total knee arthroplasty (right), before surgery (blue circles) and one year after surgery (red circles). Non-parametric regression lines are superimposed (before surgery: blue line, one year after surgery: red line).

