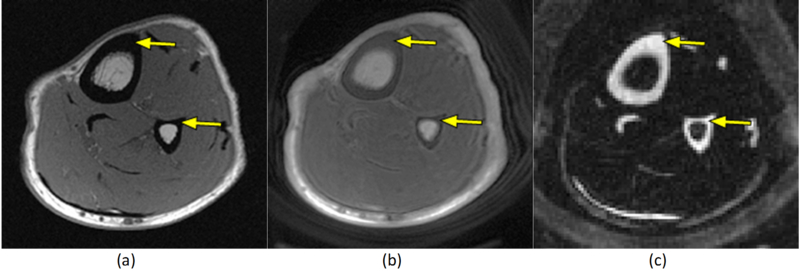
Figure 1:
Axial MR images of the leg of a healthy volunteer. (a) Clinical gradient echo sequence shows signal void in the tibial and fibular cortices (arrows). (b) UTE sequence with 32 μs echo time shows a high signal in the cortical bone (arrow). (c) IR-UTE sequence provides high contrast for the short T2* components of cortical bone (arrow), by selectively suppressing signal from fat and muscle.

