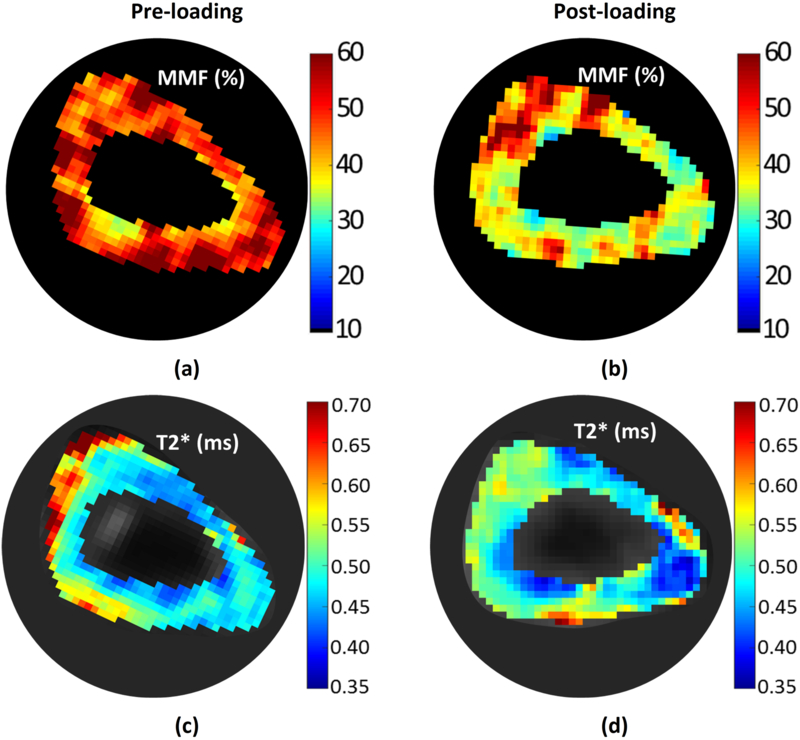
Figure 4:
Pixel maps of (a,b) macromolecular fraction (MMF) and (c,d) single-component T2* for a representative sample (sample I), at pre- and post-loading stages. These two parameter have presented significant variation on average by ex vivo BSI (Table 2). The MMF and T2* decreases are obvious in whole section of sample I.

