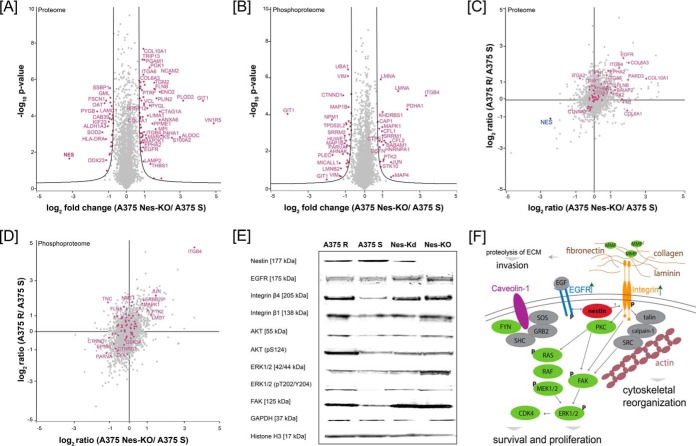
Fig. 4.
Loss of nestin is associated with to PI3K/AKT signaling. Volcano plot of nestin CRISPR/Cas9 knockout (Nes-KO) versus vemurafenib-sensitive (A375 S) cells (A) proteome and (B) phosphoproteome. Fold change of SILAC ratios between A375 Nes-KO and A375 S (log2) are plotted against p value (−log10) (n = 3). Black lines indicate the significance threshold (FDR < 0.01; s0 = 1). Significantly up- and downregulated proteins are highlighted in magenta. C, Proteome correlation of Nes-KO relative to A375 S against A375 R relative to A375 S. Magenta: proteins involved in integrin signaling using GO annotation. D, Correlation of phosphorylation sites of Nes-KO relative to A375 S against A375 R relative to A375 S. Magenta: proteins involved in integrin signaling using GO annotation. E, Western blot analysis of A375 R, A375 S, siRNA knockdown cells Nes-Kd and CRISPR/Cas9 knockout cells Nes-KO against key molecules of the integrin signaling, MAPK/ERK and PI3K/AKT signaling pathways. F, Schematic overview of proposed interaction of nestin with key molecules of integrin, MAPK/ERK signaling pathway. Green: upregulated in A375 Nes-KO versus A375 S cells, red: downregulated in A375 Nes-KO versus A375 S cells, gray: not quantified; P: identified upregulated phosphorylation site in A375 Nes-KO versus A375 S cells; arrows: indicate upregulated receptors in A375 Nes-KO versus A375 S cells.

