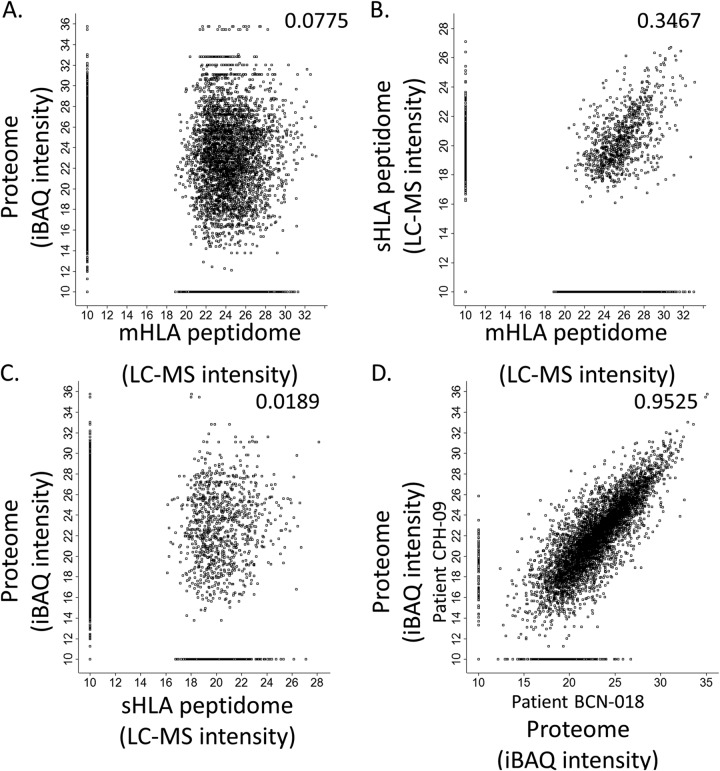
Fig. 5.
Comparison between the tumor proteomes and HLA peptidomes: Comparison between the tumor proteome and mHLA peptidome (A), plasma sHLA and tumor mHLA peptidome (B), between the tumor proteome and plasma sHLA peptidome (C) of patient CPH-09, and comparison between the tumor proteomes of two different patients, CPH-09 and BCN-018 (D). Only gene products observed as both proteins and HLA peptides are displayed. Pearson correlations are indicated in each panel and the protein levels are calculated as iBAQ intensities on a Log2 scales. Missing values were replaced with arbitrary value of 10.

