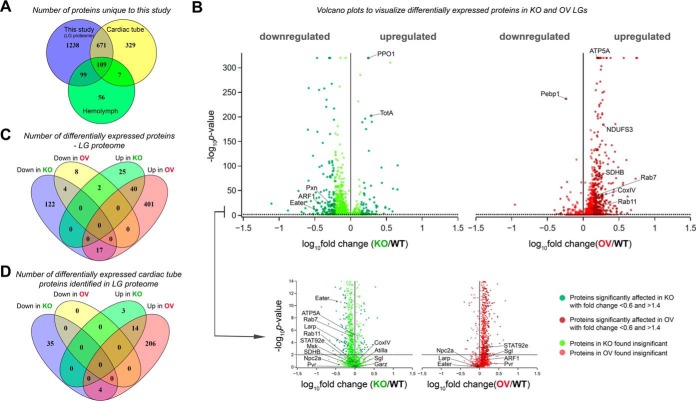
Fig. 2.
Proteomic analysis of Drosophila melanogaster lymph glands. A, Venn diagram representing the distribution of proteins in WT LG samples identified in our study and previously reported studies (17, 18). B, Representation of all identified proteins in KO and OV LGs by volcano plot. Dotted black line represents the p value cut-off used. Darker shade of color in each of the volcano plots represents the proteins whose expression is significantly affected. C, Venn diagram representing number of upregulated and downregulated differentially expressed (DE) proteins in KO and OV LGs. D, Venn diagram representing number of cardiac tube proteins DE in KO and OV LGs.

