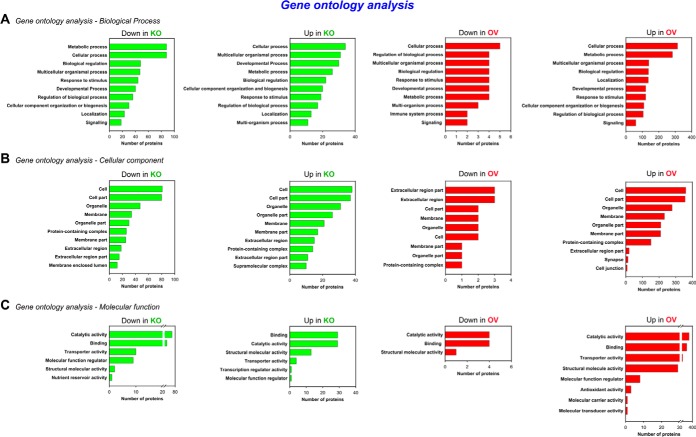
Fig. 3.
Functional enrichment analysis. Bar plots representing Gene Ontology analysis of the differentially expressed proteins based on (A) biological process, (B) cellular component and (C) molecular function, done using the g:Profiler classification. The x axis shows the number of proteins in each category.

