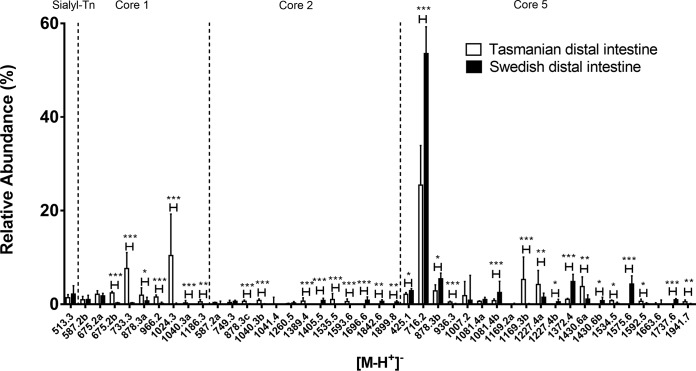
Fig. 7.
Relative abundances of Atlantic salmon distal intestinal mucin O-glycans from Tasmania and Sweden. Mucin O-glycans with at least one value above 1% were compared (for all O-glycans see supplemental Table S1). The diagram shows O-glycan structure masses sorted by core structure. Error bars show the interquartile range. Significance was calculated using Mann-Whitney U-tests (* p value <0.05, ** p value <0.01, *** p value <0.001).

