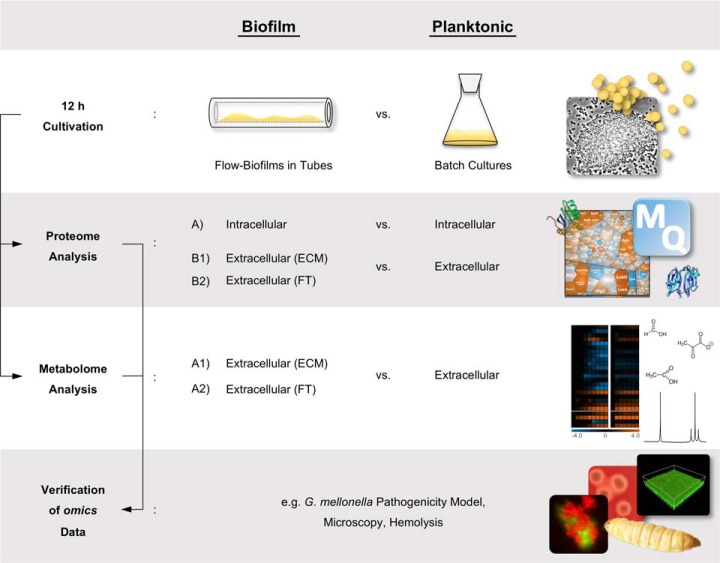
Fig. 1.
Schematic overview of the experimental design. Intracellular, ECM and FT protein profiles of 12 h biofilm cultures grown under flow conditions were compared with intracellular and extracellular protein profiles of 12 h planktonic batch cultures. These data were complemented by metabolic footprint analysis followed by verification of the omics data by different phenotypic analyses e.g. including a G. mellonella pathogenicity model and microscopy. ECM = Extracellular matrix, FT = Flow-through.

