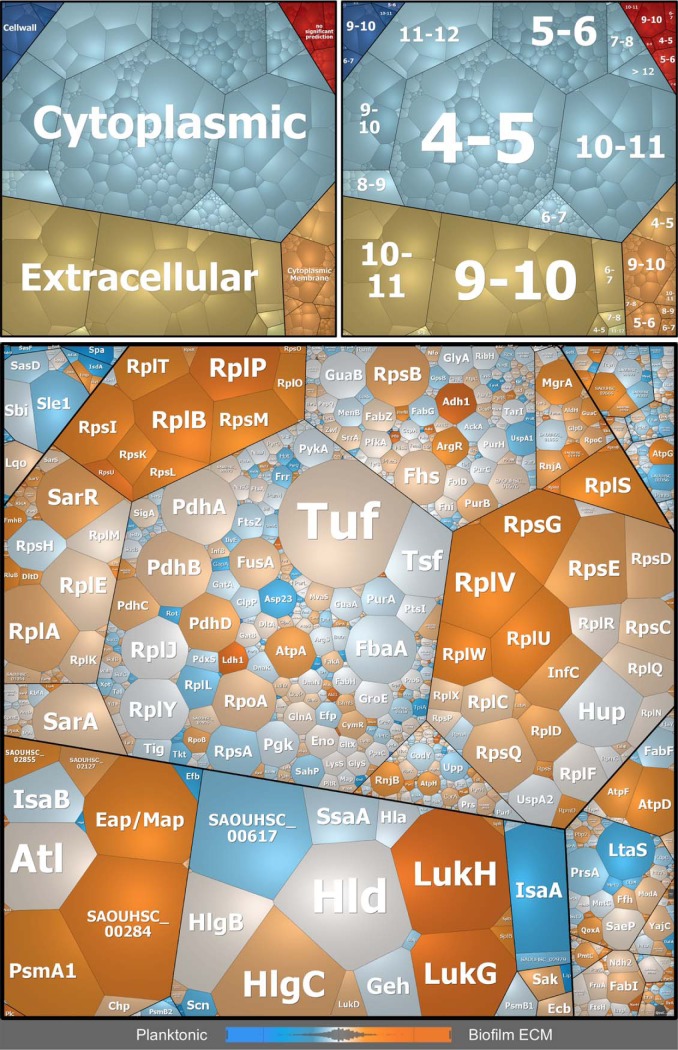
Fig. 4.
Differences in protein profiles of the biofilm ECM and extracellular planktonic samples visualized by Voronoi treemaps. Proteins found in MS analyses are displayed as single cells, which sizes correlate with protein abundance based on riBAQ values of ECM proteins. Proteins are clustered according to their subcellular localization predicted by PSORTb (upper left panel), and isoelectric point (pI) according to AureoWiki (upper right panel). Bottom panel: Differences in protein abundance between biofilm ECM and extracellular planktonic samples are indicated by a color code, which is based on LFQ intensities: orange = proteins more abundant in ECM, blue = proteins more abundant in planktonic cultures, light gray = no difference in protein abundance. ECM = Extracellular matrix.

