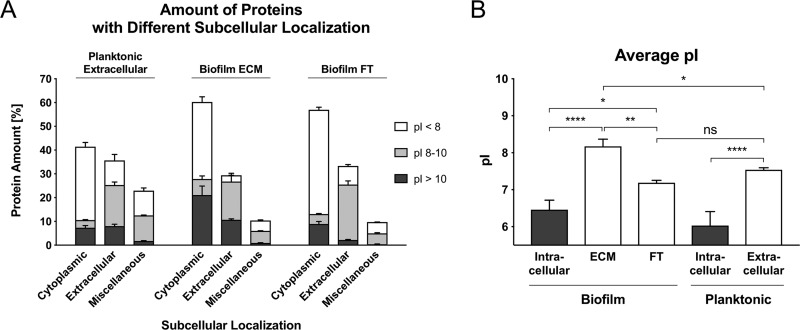
Fig. 5.
Amount of proteins with different subcellular localizations and differences in the average pI. A, Relative abundance of proteins with different subcellular localizations (predicted by PSORTb and manually cured: Cytoplasmic, Extracellular and Miscellaneous = Cytoplasmic membrane, Cell wall, no significant prediction) and different pI values, which were identified in extracellular planktonic samples, biofilm ECM and biofilm FT samples. The relative protein abundance was calculated based on riBAQ values. B, The average isoelectric point (pI) was calculated and normalized by protein abundance based on riBAQ values. Data are displayed as mean values ± S.D. of triplicate experiments. pI values were extracted from the AureoWiki database. ns = not significant, * = p < 0.05, ** = p < 0.01, *** = p < 0.001, **** = p < 0.0001. ECM = Extracellular matrix, FT = Flow-through.

