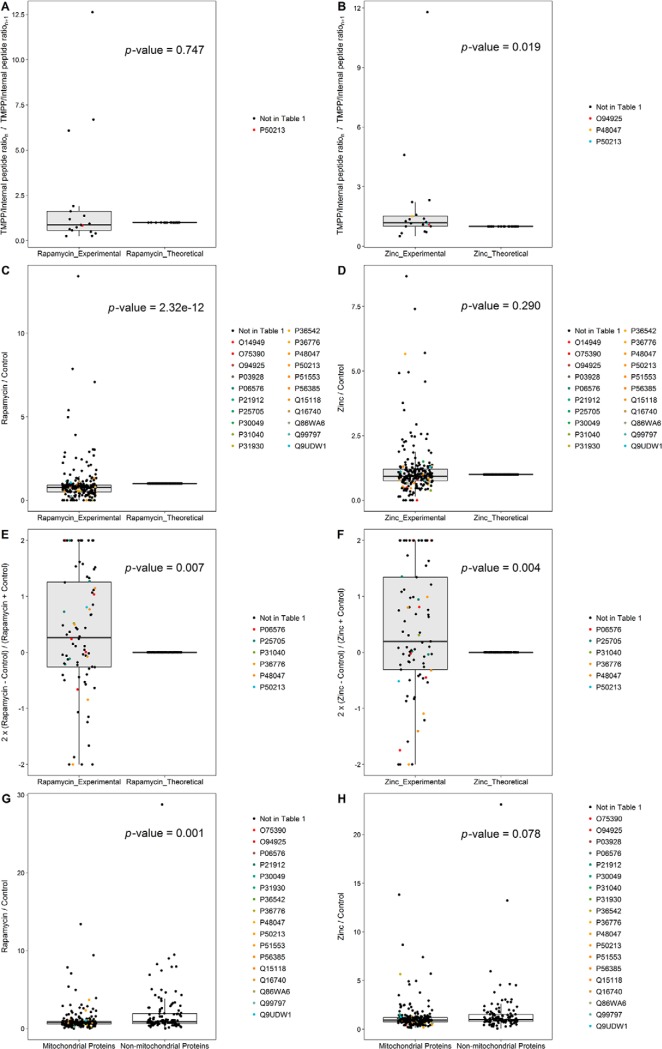
Fig. 2.
Wilcoxon signed-rank test results (A to F) and Wilcoxon rank-sum test results (G, H). Box plots represent the ranking of the compared groups, while evaluating the influence of the treatments on the ragging process (A, rapamycin treatment; B, zinc treatment), on the mitochondrial processing system (C, rapamycin treatment; D, zinc treatment), on mitochondrial protein degradation (E, rapamycin treatment; F, zinc treatment) and on protein processing systems (G, rapamycin treatment; H, zinc treatment). Ratio values are plotted on the y-axes. For each group, dots represent the evaluated ratio value for N-terminal peptides. Peptides of proteins contained in Table I, if present in the compared groups, are highlighted using colors. Tests are performed at a predefined significance level of p = 0.05.

