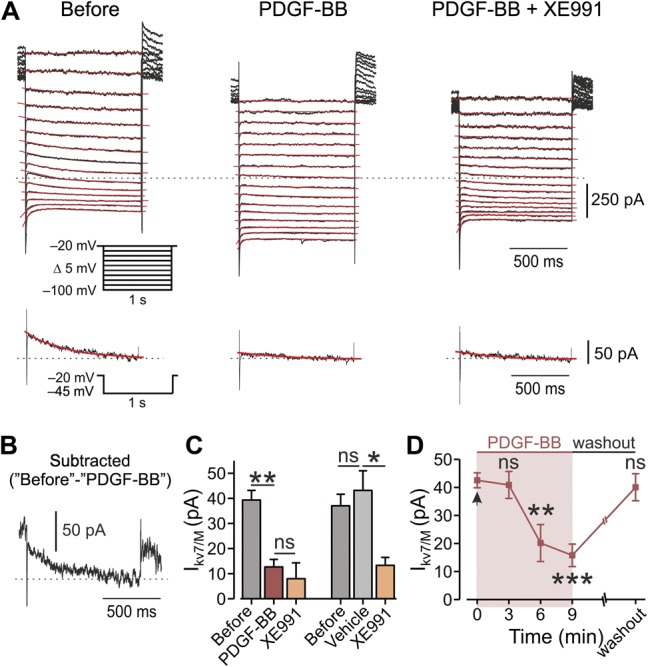
Figure 3.

Application of PDGF-BB leads to inhibition of IM in DRG neurons. (A) Voltage-clamp perforated patch recordings from DRG neurons showing families of IM evoked by a series of 1-second, 5-mV hyperpolarizing voltage steps from a holding potential of −20 mV (shown in inset). The 3 subpanels show the current responses before (left), after focal application of 125 ng/mL of PDGF-BB (middle), and after bath application of 10 μM of XE991 on top of focal application of PDGF-BB (right). The dotted line indicates zero current level. The current response obtained by stepping to −45 mV is shown at the bottom of each subpanel. The IM relaxation was fitted with a biexponential line (red), which was extrapolated to the beginning of the voltage step. (B) Subtracted trace of IM evoked by stepping to −45 mV before the application of PDGF-BB minus IM trace evoked by stepping to −45 mV after PDGF. (C) Left, bar graph depicting mean ± SEM of peak IM amplitude (measured by stepping to −45 mV), before (gray), 10 minutes after the application of PDGF-BB (red), and 10 minutes after the treatment with XE991 on top of PDGF-BB (orange). **P < 0.01, ns, not significant, RM one-way ANOVA with post hoc Bonferroni test, n = 7 neurons. Right, same as left but showing that a 10-minute application of vehicle (light gray) has no effect on IM amplitude, ns, not significant, *P < 0.05, RM one-way ANOVA with post hoc Bonferroni test n = 5 neurons. (D) Peak IM amplitude (measured by stepping to −45 mV, mean ± SEM), plotted vs time of application of PDGF-BB. Platelet-derived growth factor-BB application is indicated by the arrow (time “0”). One-way ANOVA with post hoc Bonferroni test, n = 13 neurons for 6 minutes, n = 11 neurons for 9 minutes. In 7 out of 9 neurons, ∼15 minutes washout of PDGF-BB led to full recovery of IM. ns, not significant; **P < 0.01. ANOVA, analysis of variance; DRG, dorsal root ganglion; PDGF, platelet-derived growth factor; RM, repeated-measures.
