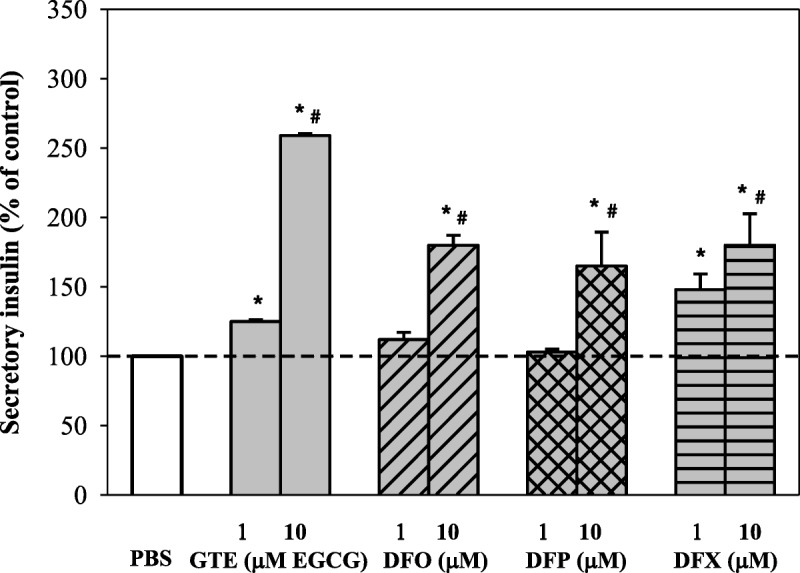
FIGURE 8.

Percent change of secretory insulin when compared with GTE (1 and 10 μM EGCG) and the chelators (1 and 10 μM each). Data obtained from 3 independent experiments are expressed as mean ± SEM. *P < 0.05 when compared with PBS; #P < 0.05 when compared with 1 μM.
