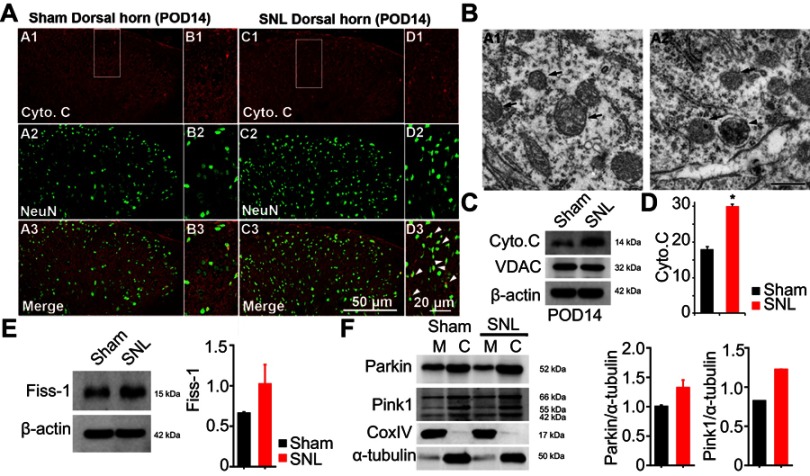
Figure 5.
Expression of mitochondrial autophagy marker cytochrome C (Cyto C) and autophagosomy in neurons of the lumbar dorsal horn POD 14. (A) Cyto C-immunoreactive (IR) cells usually co-stained with NeuN; a significant increase was shown in the ipsilateral side of SNL mice (A1-3 and B1-3) compared with the ipsilateral side of sham mice (C1-3 and D1-3). B1-3 and D1-3 is rectangular magnification. Scale bars=50 μm in A1-3 and C1-3. Scale bar=20 μm in B1-3 and D1-3. (B) Electron microscopy of neurons of the dorsal spinal cord revealed mitochondrial autophagosomy in adjacent cells (arrowheads in A2), compared to the absence of autophagosomy in healthy mitochondria of the ipsilateral spinal dorsal cells in the sham-operated control (arrows in A1). Scale bar: 500 nm. (C) The protein levels of Cyto C were detected with immunoblotting. (D) Levels of β-actin were used as the loading control and VDAC is positive control for successful mitochondria fraction. (E) The protein levels of Fiss-1 were detected with immunoblotting after mitochondria fraction. The level of β-actin was used as the loading control. (F) The protein levels of Parkin, Pink1, and CoxIV were detected with immunoblotting after mitochondria fraction. The level of α-tubulin was used as the loading control. Western blot analysis revealed that the levels of Cyto C showed a significant change in SNL mice. The bars indicate mean ± SEM, where *P<0.05, n=8 compared with the sham group.

