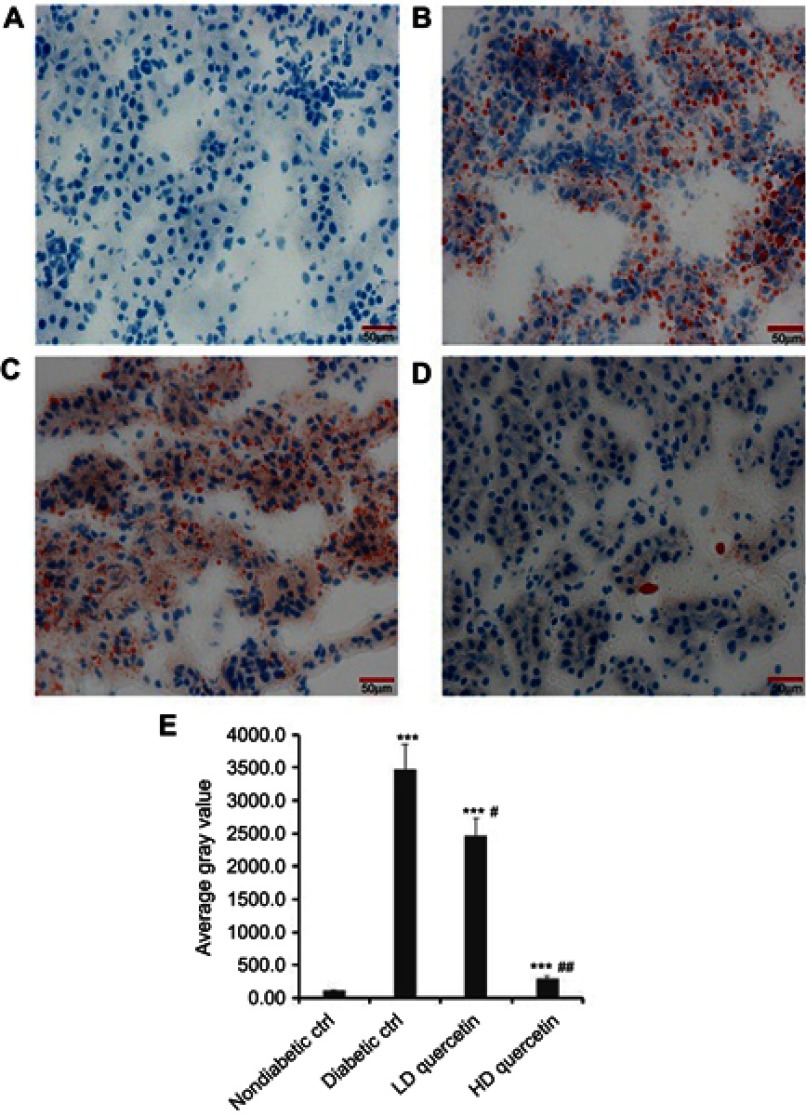
Figure 7.
Effect of quercetin on the lipid accumulation in renal sections after administration for 10 weeks. Representative photomicrographs of Oil-Red-O staining (bar =50 μm in the field) in frozen kidney sections from db/m mice (A), db/db control mice (B), LD-quercetin treated db/db mice (C), and HD-quercetin treated db/db mice (D); (E) average gray value in different groups. The data obtained from three independent experimental studies are presented as the mean ± SD. ***P<0.001, compared with both non-diabetic groups; #P<0.05 or ##P<0.01, compared with diabetic control group.
Abbreviations: LD-quercetin, low dose quercetin; HD-quercetin, high dose quercetin; ctrl, control.

