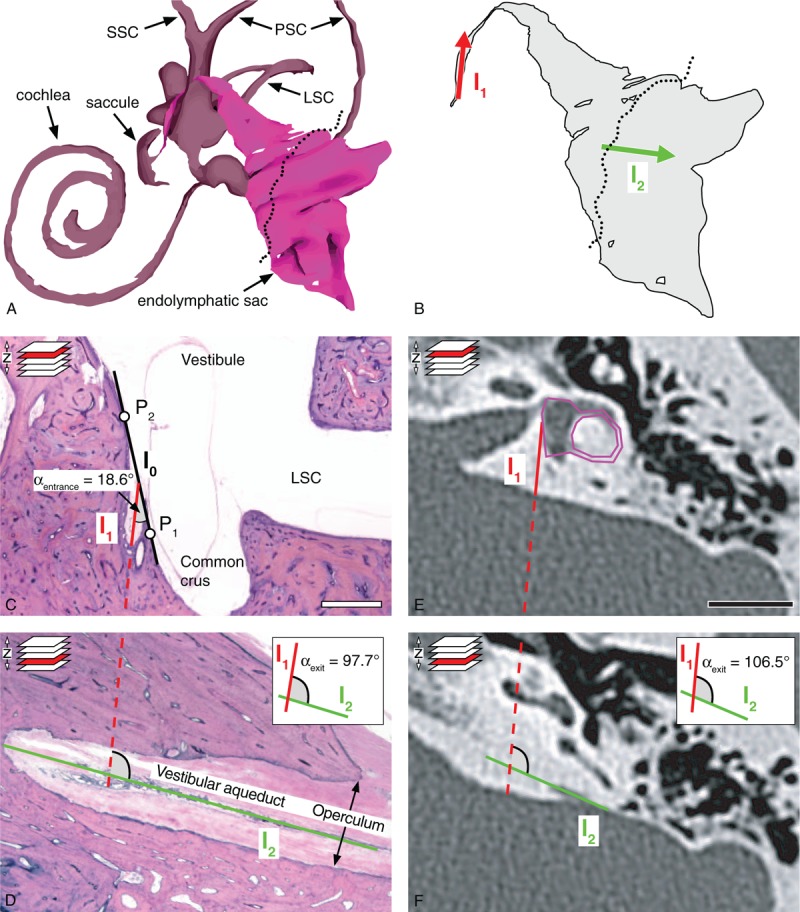
FIG. 1.

Methods to determine αentrance and αexit, i.e., the angular trajectory of the vestibular aqueduct (ATVA), in histological sections and CT images. A, 3D reconstruction of the endolymphatic space of a human (normal adult) inner ear. The dotted line indicates the opening of the opercular region. B, Endolymphatic duct and endolymphatic sac. Lines l1 (red) and l2 (green) used for assessing αexit are indicated. C and D, Histological assessment of αexit in a normal adult temporal bone. E and F, Software-based method to determine αexit from temporal bone CT images. See text for details. Scale bars: (D and E) 1 cm. CT indicates computed tomography; LSC, lateral semicircular canal; PSC, posterior semicircular canal; SCC, superior semicircular canal. Images of 3D models for A and B have been adapted from the 3D temporal bone model of the Eaton-Peabody Laboratory Massachusetts Eye and Ear Infirmary, Boston, MA (5).
