
FIG. 2.
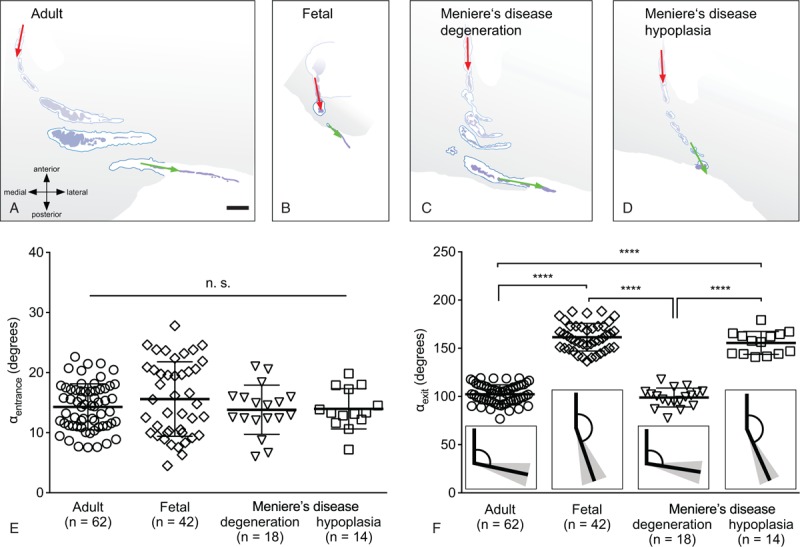
Angular trajectory of the vestibular aqueduct (ATVA, i.e., αentrance and αexit) measurement in normal adults, fetuses, and Menière's disease (MD) cases. (A–D) 2D-reconstructed course of the right vestibular aqueduct from multiple (3–6) histological sections in a normal adult case (79 years; A), a fetus (gestational week 8; B), an MD case with a degenerated endolymphatic sac (ES) (94 yr; C), and an MD case with a hypoplastic ES (97 yr; D). (E and F) Values of αentrance (E) and αexit (F) in normal adults, fetuses, and MD cases (degenerated ES, hypoplastic ES). Insets in (F) illustrate the mean angle (black lines) and the corresponding standard deviations (gray-shaded areas). Statistics: ∗∗∗∗p < 0.0001; CT indicates computed tomography; n.s., not significant. Scale bar: (A–D) 1 mm.