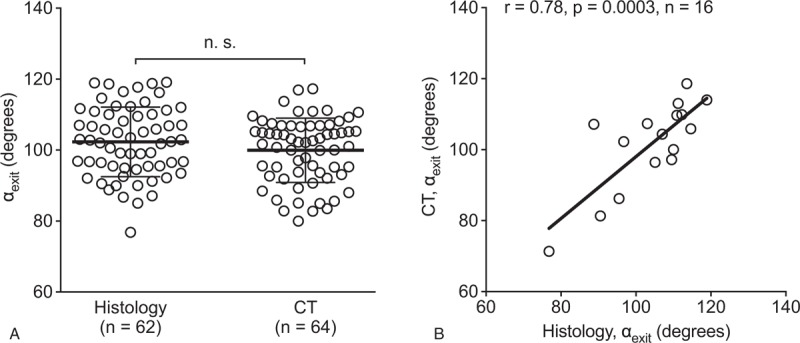
FIG. 3.

Normal αexit assessed in histology and CT imaging data. A, αexit as determined in two independent groups (first group: histology; second group: CT images). B, Correlation of angle values as determined from histological sections and CT images derived from the same temporal bone specimens. CT indicates computed tomography; n.s., not significant.
