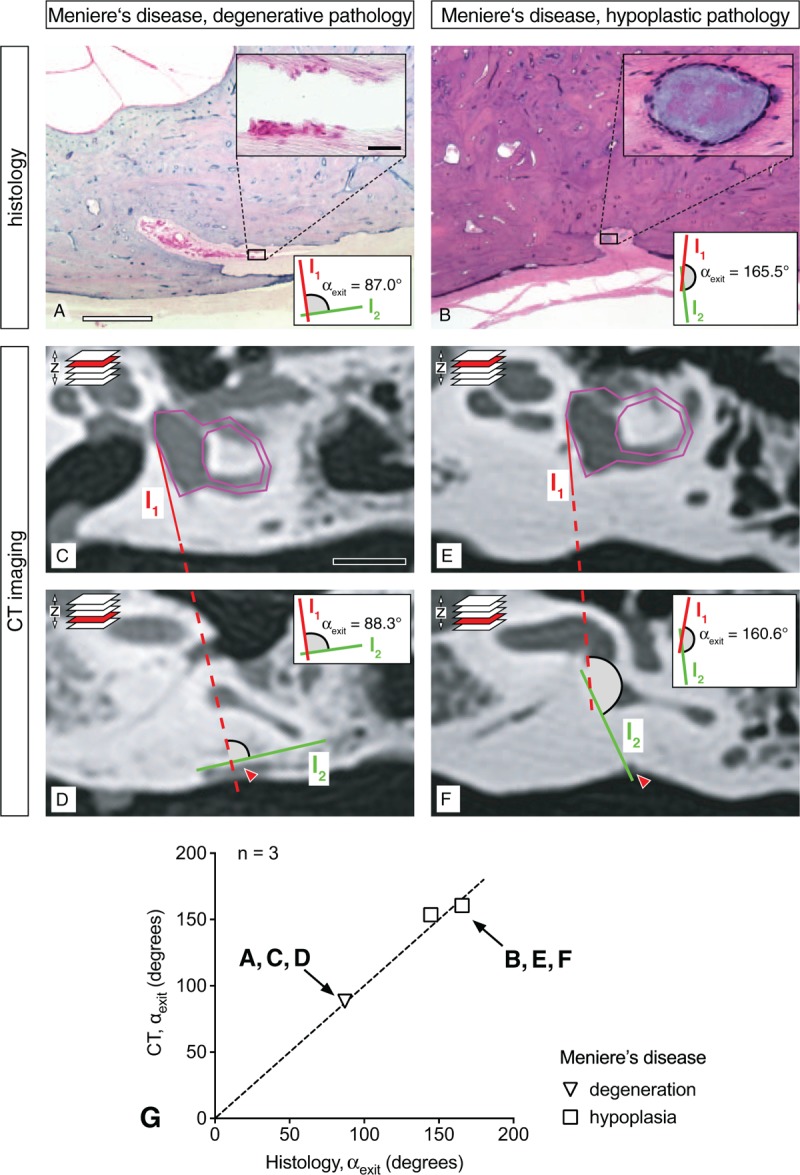
FIG. 4.

Correlation of endolymphatic sac (ES) pathology and αexit (histology and CT imaging) in Menière's disease (MD). A and B, Histological sections (opercular region) from a case of degenerative ES pathology (A; inset: degenerated ES epithelium) and a case of hypoplastic ES pathology (B; inset: cyst-like distal end of the ES). (C–F) CT images from the same specimens as in (A) and (B) in the axial focal plane of the opercular region. (E) Correlation of values for the αexit as determined in CT images and histological sections from the same specimens (n = 3, from two MD cases). Dashed line indicates 100% correlation (r = 1); scale bars: (A–B) 1 mm, inset in (A–B) 50 μm, (C–D) 10 mm. Red arrows in (C–F) indicate the opercular region. CT indicates computed tomography.
