

Abstract
Objectives
If patients experience health care–related adverse events, they may claim for compensation. Adverse events of claimants are generally more severe and presumably involve higher health care costs than those of nonclaimants. The aim of this study was to estimate the cost differential between claimants and nonclaimants in the no-fault system in Finland.
Methods
We compiled register data on patients having had coronary artery bypass grafting (CABG, n = 20,500), total hip arthroplasty (n = 17,506), or knee arthroplasty (TKA, n = 18,512) and calculated risk-adjusted cost differentials by using a gamma distributed, log-linked generalized linear model. The explained variable comprised costs, whereas the main explanatory variables were whether the patient filed a claim and whether he or she received compensation.
Results
Uncompensated claimants had higher admission costs (CABG, €3660, 29%; total hip arthroplasty, €418, 5%; TKA, €359, 4%) compared with nonclaimants, whereas the differential between compensated claimants and uncompensated claimants was statistically insignificant. Significant associations emerged concerning CABG 1-year costs: uncompensated claimants had €12,990 (71%) higher costs than nonclaimants, whereas compensated claimants had €6388 (20%) higher costs than uncompensated claimants.
Conclusions
Although the precise cost differentials may be specific to Finland, the implications may apply also to other countries. (1) Excess costs of claimants should motivate efforts to reduce adverse events. (2) Analyses of claims to improve patient safety should not be restricted to compensated claims only but should equally concern uncompensated claims. A further implication regarding Finland is that additional approaches to identify and report adverse events are necessary.
Key Words: health care costs, malpractice, no-fault insurance, compensation and redress, coronary artery bypass surgery, arthroplasty
Adverse events are generally defined as “incidents that have resulted in harm to a patient.”1 They occur in approximately 10% of inpatient admissions, yet their nature and severity vary greatly.2 Adverse events create huge costs for the health care system and the society. Knowledge on the costs of adverse events is important because it can motivate efforts to reduce adverse events and improve patient safety. Moreover, health care managers, care financiers, and others responsible for health care budget planning can use such knowledge for estimating the magnitude and duration of cost increases following adverse events.
Costs imposed by adverse events on the health care system have often been calculated by estimating the costs of additional bed days or by using patient safety indicators such as the Agency for Healthcare Research and Quality (AHRQ) indicators.3,4 Each of these methods has its strengths and weaknesses. For instance, AHRQ indicators measure a defined selection of adverse events so that calculations based on AHRQ indicators produce information on those adverse events for which AHRQ indicators exist. Additional means to measuring and monitoring adverse event costs are therefore needed.
The aim of this study was to calculate health care costs of patients who have filed a claim for compensation—presumably because of an adverse event—and compare these with the costs of patients who have not filed a claim. The aim was to provide a new perspective on adverse event costs that other methods have not captured before.
Association Between Claims and Adverse Events
If patients have experienced an adverse event, they may claim for compensation. The processing of patients' claims usually occurs via one of the 2 systems: tort or no-fault. A tort system is defined as a “court-based system…, in which the victim of an injury is awarded compensation, paid by the injurer, only if she can establish that the injurer in question was at fault for her injury.”5 In contrast, a no-fault (sometimes also called no-blame) is “a system that uses an administrative system rather than the courts to compensate injuries independent of provider negligence or fault.”6 The former is the prevailing system in the United States and some European countries, whereas the latter exists in the Nordic countries and New Zealand.
Only a small group of patients who have experienced adverse events in association with their health care file a claim,7–11 from 1% to 2% according to studies mentioned in Table 1. Reasons for the small rate has been discussed, for instance, by Bismark et al10 who suggest, among other things, that patients may interpret adverse events as symptoms of their illness or that patients with minor adverse events may perceive that filing a claim is not worthwhile.
TABLE 1.
Examples of Studies That Investigated Frequencies of Adverse Events Among Claimants and Nonclaimants*

Claimants differ from patients who also have experienced adverse events but do not file a claim. The former are in general younger, and their adverse events are more severe than those of the latter.10–12 Not every claimant, however, has experienced a genuine adverse event. The share of claimants without a verifiable adverse event has varied greatly across studies, from approximately 2% to 3% to 50% (in studies in Table 1).7,8,13,14 Moreover, adverse events of compensated claimants have appeared more severe than those of uncompensated claimants.15
The connections between adverse events and claims are further highlighted by Figure 1.
FIGURE 1.
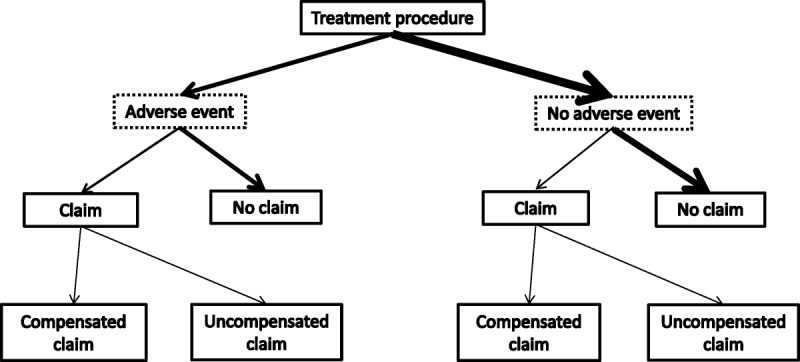
Outcomes after a treatment procedure (the breadth of the arrows roughly reflects the frequencies of individual outcomes observed in previous studies, examples of which are given in Table 1; the text boxes for “adverse event” and ”no adverse event” are drawn with dashed lines because the data in the current study did not contain any information on adverse events).
In this study, we calculated differences between compensated and uncompensated claimants as well as nonclaimants in hospital admission and 1-year health care costs. We hypothesized that patients' health care costs would follow their claimant status because claimant status has previously been associated with adverse event severity as discussed earlier: nonclaimants would have the lowest, uncompensated claimants would have the second highest, and compensated claimants would have the highest health care costs. The costs were to be adjusted for patients' comorbidities and other risk factors.
We conducted the study in the no-fault compensation scheme in Finland (the preferred term in Finland is no-blame, as claims often comprise errors), but the implications of the study may well apply also to other countries.
The Health Care System and the Compensation of Claims in Finland in Brief
In Finland, the 320 municipalities (in 2015) are the principal units to finance and organize health services. The provision of primary care largely takes place at public health centers, owned by one or several municipalities together. In contrast, the provision of specialized health care occurs mainly at public hospitals, operated by hospital districts. Hospital districts are federations of municipalities (altogether 20) that are in charge of organizing and coordinating public specialized health care within their district area. Alongside municipal health services, a range of private health services are provided.
Municipalities finance the health services they organize from municipal taxes and subsidies allocated by the state as well as to a small extent from user charges. Funding of health services is mainly public.
The processing of claims for compensation takes place within an administrative scheme that can be described as a no-fault (or no-blame) scheme. The scheme is run by the Patient Insurance Centre and directed by the Patient Injury Act.16 The Act does not presume evidence of guilt of a health professional and may also allow for compensation for deficiencies in the organization and management of the patient's treatment processes.
According to the Patient Injury Act, compensation is due if the patient's care did not reach the standard of an experienced health professional and for that reason was avoidable. In addition to this so-called treatment injury criterion, a patient may obtain compensation for an injury that resulted from defective equipment, damages to health care facilities, an accident during her care (e.g., ambulance transportation), or deficiencies in the delivery of pharmaceuticals. Moreover, compensation is payable for an infection or an excessive injury in cases specified in greater detail by the Patient Injury Act.
The Patient Insurance Centre decides on the compensability of a claim on the basis of the patient's written summary of the events, medical records including x-rays, as well as statements issued by experts. The Centre further decides on the monetary amount of compensation, which includes compensation for income losses, health care user charges, and immaterial costs.
The bulk of adverse event costs are born, both in cases where these are and are not associated with a claim, by the health care system itself and ultimately by the main payers of health care, the state and the municipalities. The health care system is also the main payer for compensation payments to patients, with the hospital districts bearing the full liability for compensation payments within their geographical area (except for 1 hospital district that cancelled its contract with the Patient Insurance Centre as of 2012 and enlisted a private insurance company to cover payments; an additional exception is the private sector that finances compensation payments from private insurance).
METHODS
We collected data from the Hospital Discharge Register on patients having been operated on in the public sector in Finland between 1998 and 2003 and having had coronary artery bypass grafting (CABG), total hip arthroplasty (THA), or total knee arthroplasty (TKA). With regard to CABG, we excluded patients with a simultaneous valve operation, whereas with regard to THA and TKA, we applied mostly the same criteria as a study on the costs and outcomes of hip and knee arthroplasty surgery in Finland to include patients with primary osteoarthritis.17
Data on the cost of the initial admission involving one of the previously mentioned surgical procedures and 1-year health care costs were obtainable from data compiled in the national PERFECT project [Performance, Effectiveness, and Costs of Treatment Episodes].18 The project had calculated hospital costs based on diagnosis-related groups (DRGs) that were adjusted for length of stay, a method similar to the costing method recommended by a subsequent study.19 Because THA and TKA are classifiable into 1 single DRG only (the same DRG for both), THA and TKA costs were obtainable from modeling patient-level real-cost data taken from 1 large hospital district in Finland.18 Concerning 1-year costs, the PERFECT project calculated these by adding to the costs of the initial admission the costs of patient's inpatient bed days and outpatient visits over 1 year from the initial admission. Bed day and outpatient visit costs were obtained by following the methodology of the standard unit cost report.20 Finally, both initial admission and 1-year costs were deflated to the year 2008 with the price index of public expenditure (restricted to municipal health care) available from official statistics in Finland (Table 2).
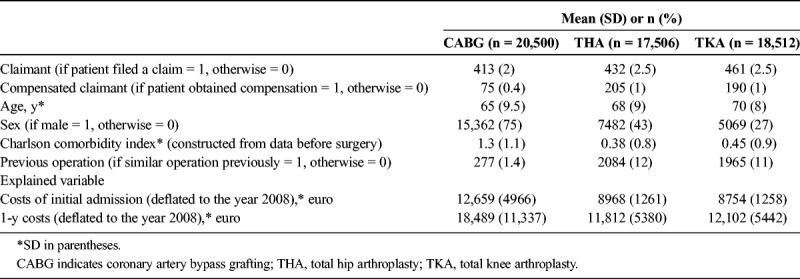
TABLE 2.
Descriptive Statistics on CABG, THA, and TKA Patients in Public Hospitals in Finland From 1998 to 2003
Costs of the initial admission and 1-year costs comprised the costs of all inpatient and outpatient specialized health care including inpatient use of pharmaceuticals but not outpatient primary and private health care as well as outpatient use of pharmaceuticals. Compensation payments paid by the Patient Insurance Centre were not taken into account.
Data on claims concerning health care provided between 1998 and 2003 were available from the Patient Insurance Centre's register. The Centre's data were linked with the data set retrieved from the Hospital Discharge Register by using information present in both registers: patients' personal identity number, injury date, as well as hospital, procedure, and diagnosis codes21 (precise linking criteria are available from the authors upon request). After the linking procedures, it seemed that 2% to 2.5% of the operated patients had filed a claim (Table 2). Of the claimants with CABG, only 18% had obtained compensation, whereas with regard to THA and TKA, the corresponding figure was 47% and 41%, respectively. These differing compensation rates might emerge from the stringency with which the Patient Insurance Centre handles different types of compensable injuries. The compensation of infection injuries, the most common type of compensable injuries with regard to CABG, is possibly stricter than the compensation of treatment injuries, which are the most common type of compensable injuries with regard to THA and TKA.
The patient characteristics accounted for were patient's age, sex, comorbidities, and whether the patient had undergone the same operation previously (for THA and TKA, a previous operation would have been contralateral) (Table 2). The last characteristic was controlled for because a previous similar operation is likely to bring additional knowledge of patient's risks and expected outcomes and consequently to reduce costs from diagnostic tests and other services.
Patient's comorbidities were taken into account by the Charlson comorbidity index.22 The index was constructed here by using information from the Hospital Discharge Register. The register contains data from 1987 onward so that patients' comorbidities from 1987 until the patient's CABG, THA, or TKA procedures—but not those recorded for the admission involving the procedure—were taken into account in the construction of the index (in the case of CABG, comorbidities over a period of 11 years before the CABG admission were taken into account).
We constructed a statistical model in which the explained variable was the costs of the initial admission (first analyses) and 1-year health care costs (second analyses), whereas the explanatory variables were patient's claimant status, the patient characteristics described earlier, as well as year and hospital fixed effects. The number of hospitals having performed CABG was 6, whereas the number of hospitals having performed THA and TKA was 35. In the case of the latter 2, the smallest hospitals that had performed less than 50 operations per year on average (19 hospitals in the case of THA and 18 hospitals in the case of TKA, which together had operated on approximately 16% of the patients) were merged and treated as 1 hospital.
Patient's claimant status was depicted by 2 cumulatively defined dummy variables, of which the first indicated whether the patient filed a claim and the second whether the patient obtained compensation (Table 2). Consequently, the interpretation of the results was as follows: the health care costs of uncompensated claimants were compared with nonclaimants, and the costs of compensated claimants were compared with uncompensated claimants. The cost differential between compensated claimants and nonclaimants was obtainable by summing up the cost differential between uncompensated claimants and nonclaimants as well as the cost differential between compensated claimants and uncompensated claimants.
Because the distribution of both the initial admission and the 1-year health care costs were highly skewed to the right (observable for the unadjusted costs in Table 3, where the median is generally smaller than the mean), we applied a generalized linear model with a log link function assuming gamma distribution. This method has been used in previous studies that have modeled skewed cost data.23,24
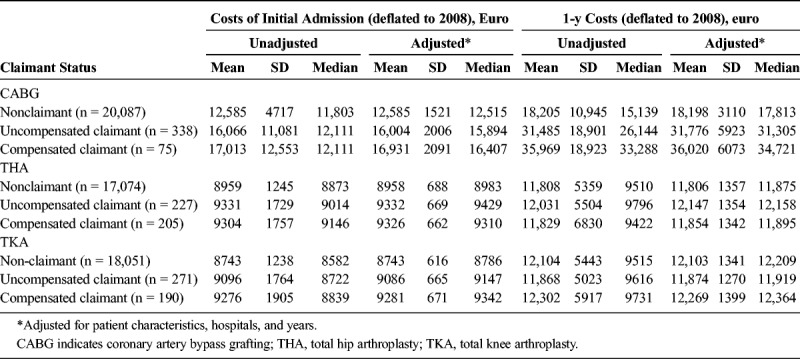
TABLE 3.
Health Care Costs of Claimants and Nonclaimants (Mean, SD, and Median)
Based on the generalized linear models, we calculated the so-called marginal effects for patient's claimant status similarly to studies that have investigated the impact of an adverse event on costs (for instance, Carey et al4), although here using the 2 cumulatively defined dummy variables. First, we calculated a predicted value for each individual for the situation when the patients in the data were uncompensated claimants (the variable representing claimant was given the value 1, and the variable representing compensated claimant was given the value 0) and then calculated a predicted value for each individual for the situation when the patients were nonclaimants (the variable representing claimant and compensated claimant were both given the value 0). After that, we obtained the difference in the averages of the predicted values in the 2 situations (Table 4).
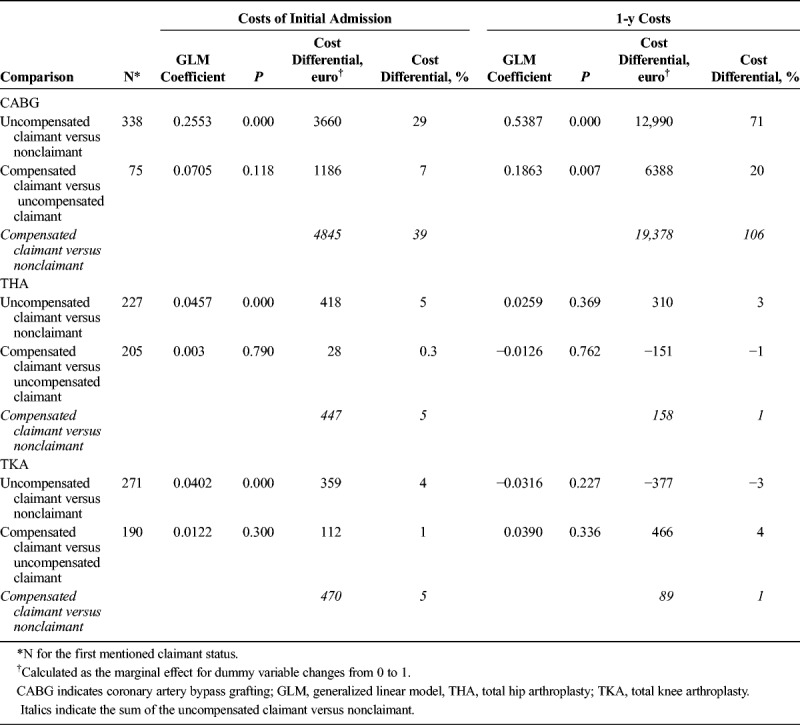
TABLE 4.
Results of the GLM (Patient Characteristics, Hospitals, and Years Adjusted)
The so-called marginal effect of compensated versus uncompensated claimants was obtainable by calculating the predicted values for the situation when the variable representing compensated claimant had the value 1 and the variable representing claimant had the value 1 and for the situation when the variable representing compensated claimant had the value 0 and the variable representing claimant had the value 1. From these, the difference in the averages of predicted values was obtainable and shown as the cost differential between compensated claimants and uncompensated claimants.
The computer software package used for the statistical analyses was Stata/SE 10.0.
The study was approved by the ethics committee of STAKES, the predecessor of the National Institute for Health and Welfare (THL), Finland.
RESULTS
Calculated from Table 2, with regard to CABG, the costs of the initial admission consisted of 68% of the 1-year costs, whereas with regard to THA, these costs consisted of 76%, and with regard to TKA, 72% of the 1-year costs. Descriptive statistics shown in Table 3 suggest that mean risk-adjusted costs increased stepwise according to patients' claimant status: nonclaimants had the lowest, uncompensated claimants had the second highest, and compensated claimants had the highest costs on average (with some exceptions as apparent in Table 3; differences were not tested here for statistical significance). Further notable with regard to all of the 3 procedures is that adjusting the costs for patient characteristics, hospitals, and years had a negligible effect on average costs. However, risk adjustment reduced the SEs markedly, with the medians moving much closer to the means.
In the generalized linear model, the fit of the statistical model improved when hospital and year fixed effects were included compared with when these were excluded—as assessed on basis of the log likelihood ratio test. Consequently, hospital and fixed effects were included in the final analyses.
Because of the potential correlation between patients' age and comorbidities, we tested for correlation between age and the Charlson comorbidity index. The 2 variables correlated only to a minor extent, with correlation coefficients varying between 0.10 and 0.17, depending on the surgical procedure.
Based on the generalized linear model, the costs of the initial admission of uncompensated claimants were higher than those of nonclaimants (P < 0.001), as were costs of compensated claimants compared with uncompensated claimants, although the latter difference was not statistically significant. With regard to 1-year costs, only in the case of CABG did statistically significant associations emerge: 1-year costs of uncompensated claimants were higher than those of nonclaimants (P < 0.001), as were the costs of compensated claimants compared with those of uncompensated claimants (P = 0.007) (Table 4, cost differentials adjusted for patient characteristics, hospitals, and years).
The admission costs of an uncompensated claimant as compared with a nonclaimant were €3660 (29%) higher after CABG, €418 (5%) higher after THA, and €359 (4%) higher after TKA. The admission costs of a compensated claimant as compared with an uncompensated claimant were €1186 (7%) higher after CABG, €28 (0.3%) higher after THA, and €112 (1%) higher after TKA.
With regard to CABG, the 1-year costs of an uncompensated claimant were €12,990 (71%) higher than those of a nonclaimant, and the 1-year costs of a compensated claimant were €6388 (20%) higher than those of an uncompensated claimant. The 1-year costs of an uncompensated claimant as compared with a nonclaimant were €310 (3%) higher with regard to THA and €377 (−3%) lower with regard to TKA. The 1-year costs of a compensated claimant as compared with an uncompensated claimant were €151 (−1%) lower with regard to THA and €466 (4%) higher with regard to TKA.
DISCUSSION
As hypothesized, the health care costs of a claimant were significantly higher than those of a nonclaimant. If the excess costs of individual claimants were totaled, the total excess costs associated with the care of all claimants were substantial. This is in accordance with previous research on the costs of adverse events and should motivate to continue efforts to reduce adverse events and improve patient safety.
Contrary to initial expectation, however, the health care costs of compensated claimants did not differ statistically significantly from those of uncompensated claimants (except for CABG 1-y costs). The results imply that health service use between claimants and nonclaimants differs, whereas use between compensated claimants and uncompensated claimants is fairly similar. This further implies that the severity of adverse events (or other motives for a claim, because a few claims do not involve any adverse events) differs between claimants and nonclaimants, whereas the severity of adverse events between compensated claimants and uncompensated claimants is fairly similar.
An indirect but important implication of the research is that analyses of claims to improve patient safety should not be restricted to compensated claims only but should equally concern uncompensated claims. The reason is that analyses of uncompensated claims may reveal flaws in treatment processes just as do those of compensated claims. Such flaws should obviously be subject to appropriate remedial actions and taken advantage of to improve patient safety. Furthermore, analyses of both compensated and uncompensated claims may improve judgments regarding compensation and result in the compensation of claims that would have otherwise been uncompensated.
Why the costs did not differ between compensated claimants and uncompensated claimants may have several explanations. One explanation may be preventability of the claimants' adverse events. Preventability is according to the Patient Injury Act in Finland the most frequently applied criterion for compensation, as explained earlier. Consequently, compensated claimants may have more often had adverse events that are preventable. This view is supported by previous studies that have shown the preventability of an adverse event to increase the probability of receiving compensation as compared with an unpreventable one.13,14 This indicates that the adverse events of uncompensated claimants would be as severe as those of compensated claimants but would to a greater extent be unpreventable.
The interpretation of the study results may not be that simple, however. Within the large set of all adverse events, irrespective of whether these produced a claim, adverse events have been more often preventable in patients who have experienced more severe injuries.7 More severe injuries should in principle generate higher health care costs, which should imply that the costs of compensated claimants are higher than those of uncompensated claimants. This was not the case here, however.
Another possible reason for the study's findings may be some arbitrariness in the compensation policy of the Patient Insurance Centre, although such a view is difficult to prove. It may rather be that the Centre has to decide on compensability on the basis of imperfect information. Medical records and other material available for the processing of claims may not reveal all the actions and omissions in patient care that may have contributed to the adverse events.25–27 In effect, interviews with patients conducted at or after their discharge from the hospital have shown that patients are fairly good at telling about adverse events during their care and are even able to report adverse events that were not detectable from their medical records.26,27 Applying such research findings to this study would imply that the medical records of uncompensated claimants might not disclose adverse events to the same extent as do those of compensated claimants leaving the former without compensation.
Determining whether an adverse event is preventable—the primary task of the Patient Insurance Centre—is difficult, a viewpoint expressed by many studies (for instance, de Vries et al,2 Brennan et al,7 and Farber and White15). Decisions on compensation can be based on such fine judgments that they easily fall one way or the other, with few differences remaining between those who obtain compensation and those who do not. Differences may also remain minor because generally, only patients with certain characteristics or certain kinds of adverse events file a claim or because some costly adverse events never or rarely generate a claim.
If more in-depth research was performed on the causes of adverse events experienced by claimants and that research showed compensated claimants to have had more often adverse events that were preventable compared with uncompensated claimants, the claims of the latter cannot, nevertheless, be viewed as groundless. It is not up to the patients to decide whether their adverse event was preventable.
A further noteworthy finding of the study was that the excess costs of claimants are greater and accumulate over a longer time after CABG than THA and TKA. The reason for the variation between the procedures may be that the nature and seriousness of adverse events vary between them. Coronary artery bypass grafting may result in highly dramatic complications such as stroke or long-lasting intensive unit care, whereas undesirable outcomes of THA and TKA may consist of rather obscure symptoms such as pain or limping. Moreover, adverse events after THA and TKA, such as a leg length discrepancy, are often treatable with relatively cheap medical techniques or devices, for instance, with a heal lift in a shoe.
With regard to THA and TKA, however, it cannot be ruled out that the excess costs of claimants are U-shaped over time, meaning that after a year of the operation, the cost differential between claimants and nonclaimants might start to expand again. This cost increase might derive from the increasing incidence of revision arthroplasty—an operation that surgeons attempt to postpone until all other treatment options have failed because of this operation's high risks and costs.28,29 Furthermore, the 5-year revision arthroplasty rates of hospitals have been shown to correlate with hospital-level claims rates.30 Thus, in the case of THA and TKA, to observe a statistically significant cost differential between claimants and nonclaimants in the long term, one might have to investigate costs over a time span longer than 1 year.
Unfortunately, studies on the incidence of adverse events have not been conducted in Finland. It is further regrettable that the register data set available for this research did not reveal any information on the presence, type, or severity of patients' adverse events. However, the overall adverse event rate in Finland is presumably approximately the same as in studies conducted in various countries around the world.2 Moreover, adverse events involving claims as a share of all adverse events is probably also small in Finland and similar to that in other countries.
Although we did not have precise information on claimants' and nonclaimants' adverse events, we had access to the Patient Insurance Centre's data, from which filed and compensated claims are unambiguously identifiable. Moreover, the linking of claims with data from the Hospital Discharge Register had succeeded reasonably well. Furthermore, by using claims data, the varying definitions of adverse events seen in the literature did not affect the results of the study. For this study, it suffices to think of adverse events in a broad sense and assume that they were the most likely motive for patients' claims.
Studies such as this rely on the availability of adequate data on costs. The cost data we were able to use here originated from estimations on real-cost data by using a methodology investigated and preferred by previous research.19 Accordingly, the costs were based on 2 main factors, such as the type of treatment (costs calculated for CABG, THA, and TKA separately, as explained earlier) as well as the amount of patient's hospital inpatient days. The omission of the costs of pharmaceuticals purchased for outpatient care is likely to have had a negligible effect on the obtained cost differentials because these have been estimated in a previous study to comprise only 2% to 4% of patients' 1-year health care costs.31 Similarly, the exclusion of the costs from private and public primary care visits does not substantially affect the cost differentials either, because private health care consists of a minor proportion of all health care in Finland and because public primary care generally gives rise to lesser costs than specialized health care.
This study used data on 3 types of surgical procedures and thereby on restricted patient groups. Nevertheless, the strength of the data set was that it comprised all patients with predefined characteristics treated within the public health care system in Finland.
Future research should be conducted on the kinds of data other than register-based data, for instance, interviews of patients, which can then be combined with information accumulated in claims files. This might highlight reasons for the cost differentials between the claimant groups observed in this study and indicate whether there is need for a more rigorous audit of current compensation practices.
CONCLUSIONS
Although the precise cost differentials between claimants and nonclaimants may be specific to Finland, the implications of the study may well apply also to other countries. (1) Excess costs of claimants should motivate efforts to reduce adverse events. (2) Analyses of claims to improve patient safety should not be restricted to compensated claims only but should equally concern uncompensated claims. A further implication regarding Finland in particular is that additional approaches to identify and report adverse events are necessary.
Footnotes
The authors disclose no conflict of interest.
J.J. was supported by a grant from the Yrjö Jahnsson Foundation, a private independent foundation.
REFERENCES
- 1.World Health Organization. Conceptual framework for the international classification for patient safety. Version 1.1. Final technical report. WHO, Geneva 2009. Available from: http://www.who.int/patientsafety/implementation/taxonomy/icps_technical_report_en.pdf. [Google Scholar]
- 2.de Vries EN, Ramrattan MA, Smorenburg SM, et al. The incidence and nature of in-hospital adverse events: a systematic review. Qual Saf Health Care. 2008;7:216–223. [DOI] [PMC free article] [PubMed] [Google Scholar]
- 3.Johnson WG, Brennan TA, Newhouse JP, et al. The economic consequences of medical injuries. Implications for a no-fault insurance plan. JAMA. 1992;267:2487–2492. [PubMed] [Google Scholar]
- 4.Carey K, Stefos T. Measuring the cost of hospital adverse patient safety events. Health Econ. 2011;20:1417–1430. [DOI] [PubMed] [Google Scholar]
- 5.Douglas T. Medical injury compensation: beyond ‘no-fault’. Med Law Rev. 2009;17:30–51. [DOI] [PMC free article] [PubMed] [Google Scholar]
- 6.Kessler DP, Summerton N, Graham JR. Effects of the medical liability system in Australia, the UK, and the USA. Lancet. 2006;368:240–246. [DOI] [PubMed] [Google Scholar]
- 7.Brennan TA, Leape LL, Laird NM, et al. Incidence of adverse events and negligence in hospitalized patients. Results of the Harvard Medical Practice Study I. N Engl J Med. 1991;324:370–376. [DOI] [PubMed] [Google Scholar]
- 8.Brennan TA, Sox CM, Burstin HR. Relation between negligent adverse events and the outcomes of medical-malpractice litigation. N Engl J Med. 1996;335:1963–1967. [DOI] [PubMed] [Google Scholar]
- 9.Davis P, Lay-Yee R, Briant R, et al. Adverse events in New Zealand public hospitals I: occurrence and impact. N Z Med J. 2002;115:U271. [PubMed] [Google Scholar]
- 10.Bismark MM, Brennan TA, Davis PB, et al. Claiming behaviour in a no-fault system of medical injury: a descriptive analysis of claimants and non-claimants. Med J Aust. 2006;185:203–207. [DOI] [PubMed] [Google Scholar]
- 11.Studdert DM, Thomas EJ, Burstin HR, et al. Negligent care and malpractice claiming behavior in Utah and Colorado. Med Care. 2000;38:250–260. [DOI] [PubMed] [Google Scholar]
- 12.Dunbar FC, Sabry F. The propensity to sue: why do people seek legal actions? Bus Econ. 2007;42:31–42. [Google Scholar]
- 13.Cheney FW, Posner K, Caplan RA, et al. Standard of care and anesthesia liability. JAMA. 1989;261:1599–1603. [PubMed] [Google Scholar]
- 14.Studdert DM, Mello MM, Gawande AA, et al. Claims, errors, and compensation payments in medical malpractice litigation. N Engl J Med. 2006;354:2024–2033. [DOI] [PubMed] [Google Scholar]
- 15.Farber HS, White MJ. A comparison of formal and informal dispute resolution in medical malpractice. J Legal Stud. 1994;23:777–806. [Google Scholar]
- 16.Palonen R, Nio A, Mustajoki P. Potilas- ja lääkevahingot - korvaaminen ja ennaltaehkäisy [Patient and Medication Injuries—Compensation and Prevention] [in Finnish]. Jyväskylä, Finland: Talentum Media Oy; 2005. [Google Scholar]
- 17.Mäkelä KT, Peltola M, Sund R, et al. Regional and hospital variance in performance of total hip and knee replacements: a national population-based study. Ann Med. 2011;43(Suppl 1): S31–S38. [DOI] [PubMed] [Google Scholar]
- 18.Peltola M, Juntunen M, Häkkinen U, et al. A methodological approach for register-based evaluation of cost and outcomes in health care. Ann Med. 2011;43(suppl 1):S4–S13. [DOI] [PubMed] [Google Scholar]
- 19.Geue C, Lewsey J, Lorgelly P, et al. Spoilt for choice: implications of using alternative methods of costing hospital episode statistics. Health Econ. 2012;21:1201–1216. [DOI] [PubMed] [Google Scholar]
- 20.Hujanen T, Kapiainen S, Tuominen U, et al. Terveydenhuollon yksikkökustannukset Suomessa vuonna 2006 [Health Care Standard Unit Costs in Finland in 2006] [in Finnish]. STAKES Työpapereita: Helsinki, Finland; 2008. [Google Scholar]
- 21.Järvelin J, Rosenqvist G, Häkkinen U, et al. Patient and hospital characteristics associated with claims and compensations for patient injuries in coronary artery bypass grafting in Finland. J Health Serv Res Policy. 2009;14:150–155. [DOI] [PubMed] [Google Scholar]
- 22.Charlson ME, Pompei P, Ales KL, et al. A new method of classifying prognostic comorbidity in longitudinal studies: development and validation. J Chronic Dis. 1987;40:373–383. [DOI] [PubMed] [Google Scholar]
- 23.McCullagh P, Nelder J. Generalized Linear Models. 2nd ed Boca Raton, FL: Chapman & Hall/CRC; 1989. [Google Scholar]
- 24.Blough DK, Ramsey SD. Using generalized linear models to assess medical care costs. Health Serv Outcomes Res Methodol. 2000;1:185–202. [Google Scholar]
- 25.Naessens JM, Campbell CR, Huddleston JM, et al. A comparison of hospital adverse events identified by three widely used detection methods. Int J Qual Health Care. 2009;21:301–307. [DOI] [PubMed] [Google Scholar]
- 26.Weissman JS, Schneider EC, Weingart SN, et al. Comparing patient-reported hospital adverse events with medical record review: do patients know something that hospitals do not? Ann Intern Med. 2008;149:100–108. [DOI] [PubMed] [Google Scholar]
- 27.Zhu J, Stuver SO, Epstein AM, et al. Can we rely on patients' reports of adverse events? Med Care. 2011;49:948–955. [DOI] [PubMed] [Google Scholar]
- 28.Bozic KJ, Katz P, Cisternas M, et al. Hospital resource utilization for primary and revision total hip arthroplasty. J Bone Joint Surg Am. 2005;87:570–576. [DOI] [PubMed] [Google Scholar]
- 29.Klouche S, Sariali E, Mamoudy P. Total hip arthroplasty revision due to infection: a cost analysis approach. Orthop Traumatol Surg Res. 2010;96:124–132. [DOI] [PubMed] [Google Scholar]
- 30.Järvelin J, Häkkinen U. Can patient injury claims be utilised as a quality indicator? Health Policy. 2012;104:155–162. [DOI] [PubMed] [Google Scholar]
- 31.Häkkinen U, Kurki T, Vento A, et al. Risk Adjustment in Coronary Bypass Grafting—How EuroSCORE Is Related to Cost, Health-Related Quality of Life, and Cost-effectiveness. Helsinki, Finland: National Institute for Health and Welfare; 2009. [Google Scholar]