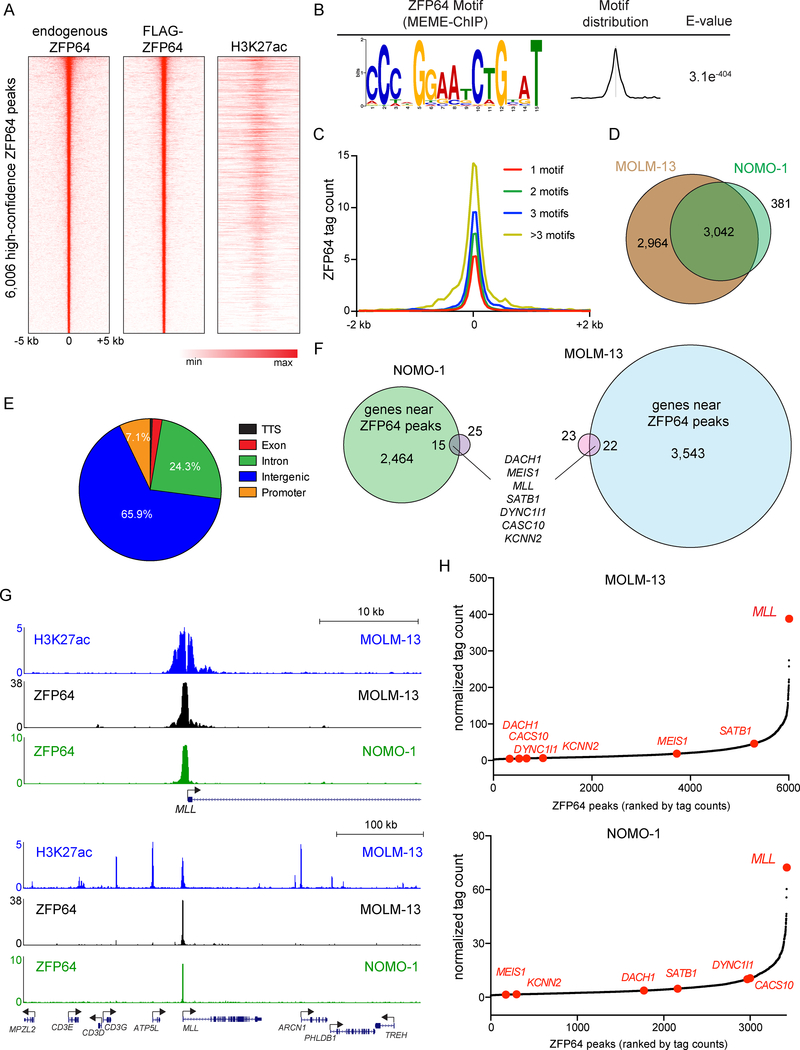
Figure 2. Epigenomic analysis of ZFP64 in MLL-rearranged leukemia cells.
(A) Density plot showing endogenous ZFP64, FLAG-ZFP64, and H3K27ac enrichment surrounding the summit of 6,006 high confidence ZFP64 peaks in MOLM-13 cells, ranked by ZFP64 peak intensity. (B) ZFP64 ChIP-seq derived de novo motif logo, distribution and E-value of the ZFP64 binding motif derived using MEME-ChIP. Expectancy value (E-value) represents the enrichment of the motif around the center of the peak binding regions and was calculated using the binomial test. (C) Meta-profile comparing ZFP64 occupancy around the summit of peaks with different motif counts. ZFP64 binding intensity is shown as sequencing depth normalized tag count. (D) Overlap of high confidence ZFP64 peak regions between MOLM-13 and NOMO-1 cells. (E) Pie chart showing the distribution of 6,006 high confidence ZPF64 peaks in MOLM-13 cells. TTS, transcription termination site. (F) Venn diagram depicting the genes significantly down-regulated after knockout of ZFP64 in MOLM-13 (blue) and NOMO-1 (green) that are also located near high-confidence ZFP64 occupancy identified using ChIP-seq (pink). Down-regulated genes were defined by log2 fold change < −0.5; p<0.05; q<0.05 in two independent biological replicates of RNA-seq analysis. (G) Gene track of H3K27ac and ZFP64 ChIP-seq occupancy at the MLL locus at two different scales in the indicated leukemia cell lines. The x axis shows genomic position and y axis shows signal of ChIP-seq occupancy in units of reads per million mapped reads. (H) Ranking of ZFP64 binding intensity at high confidence peaks from ChIP-seq in MOLM-13 and NOMO-1 cells. ZFP64 target genes from (F) are indicated in red. See also Figure S2.

