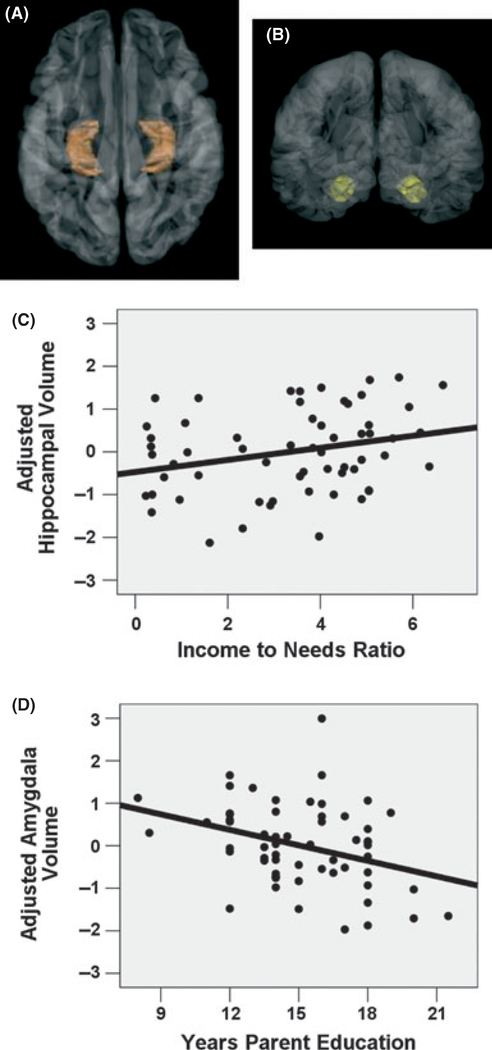
Figure 2.
Family SES predicts child hippocampus and amygdala volumes. (A) Hippocampus ROI defined in orange. (B) Amygdala ROI defined in yellow. (C) Family income-to-needs ratio is positively correlated with child hippocampal volume, adjusted for child age, gender, and total cortical volume (Beta = 0.22; p < .032). (D) Number of years of parent education is negatively correlated with child amygdala volume, adjusted for child age, gender and total cortical volume (Beta = −0.29; p < .002). In all plots, regional volume is portrayed as the standardized residual, in standard deviations, after adjusting for covariates.

