
Figure 4. Comparative efficacy testing of the Ir-silicasome in the orthotopic MC38 model.
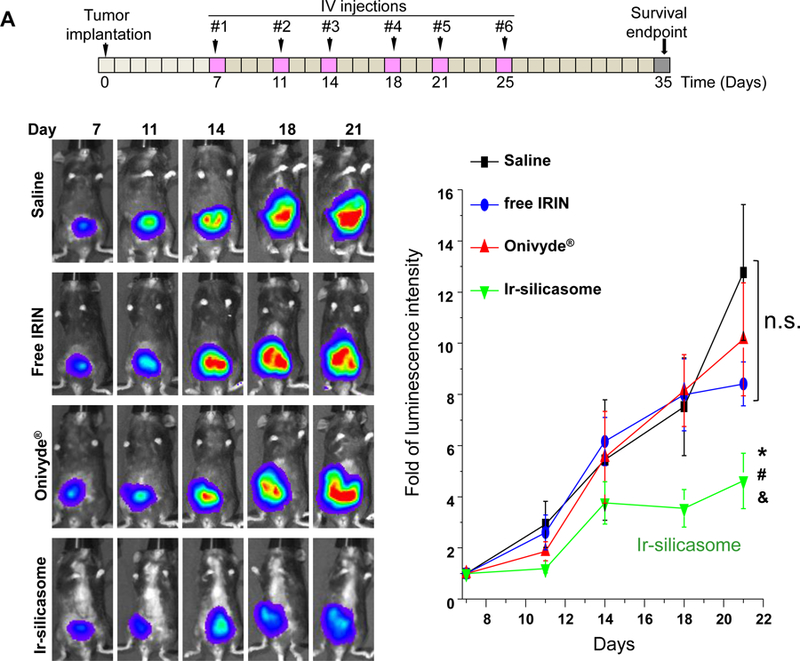
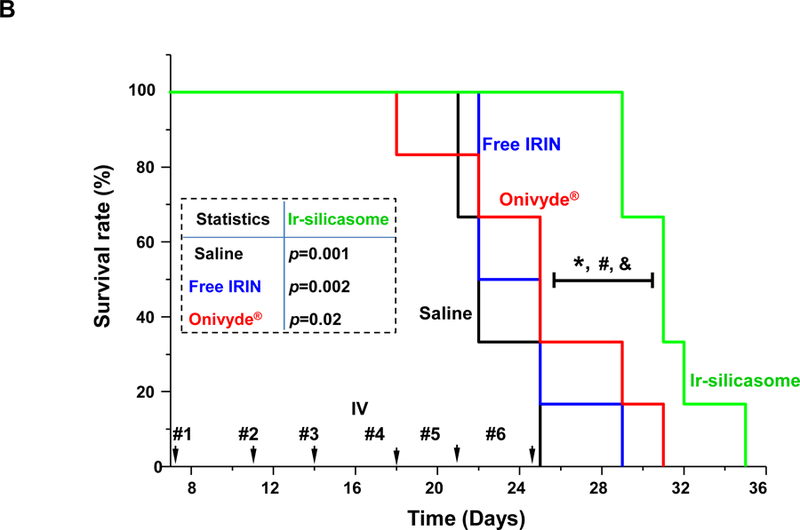
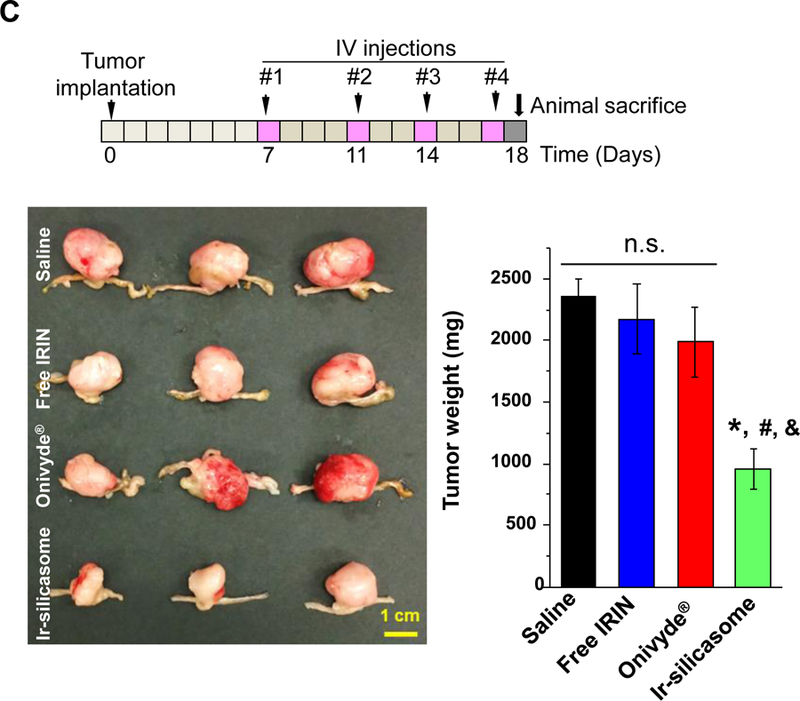
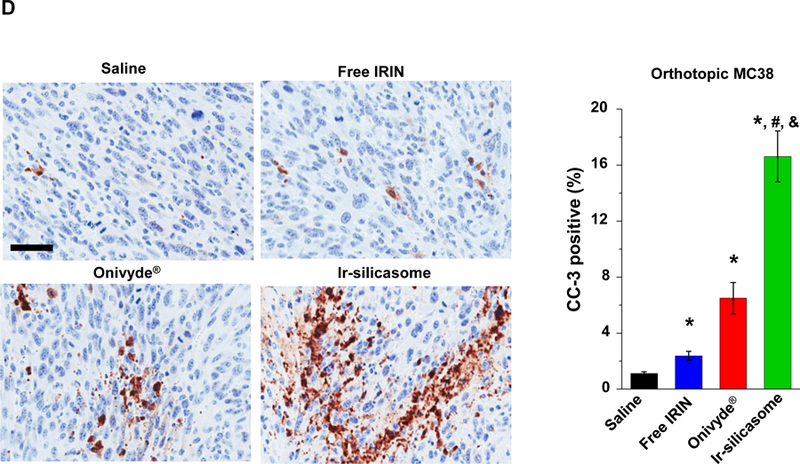
(A) A survival experiment was performed, in the course of which IVIS imaging was used to compare tumor growth up to day 21, beyond which metastatic peritoneal spread interfered in image detection. MC38 tumor-bearing mice (n = 6) received free irinotecan, Onivyde® or Ir-silicasome at an irinotecan dose equivalent of 40 mg/kg twice per week for up to six IV administrations. Saline was used as the negative control. Representative images are shown in the left panel, with quantitative data display of bioluminescence intensity at the ROI, using IVIS software. (B) Kaplan-Meier plots to display the survival rate of the different animal groups in the same experiment (*p<0.05, Log Rank test). (C) In a separate experiment, the tumor-bearing mice received similar doses as in (A) twice a week for a total of four administrations (n = 3). Animals were sacrificed at 24 hr after the last treatment (day 18). Orthotopic tumors were collected and weighed. (D) IHC analysis of cleaved caspase-3 (CC-3) expression in the orthotopic tumors harvested in (C). Quantification of the number of CC-3+ cells, using ImageScope software (right panel). Bar = 100 μm. Data represent mean ± SEM; *p<0.05 compared to saline; #p<0.05 compared to free IRIN; &p<0.05 compared to Onivyde®. “n.s.” indicates p>0.05.