Figure 1.

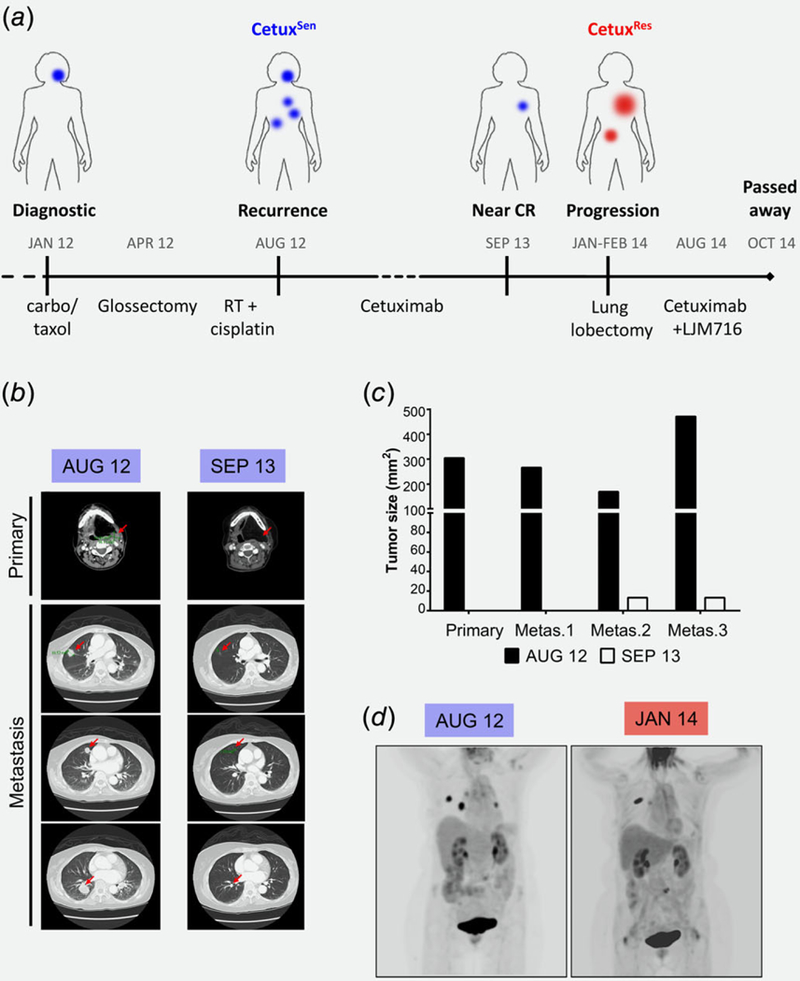
Exceptional clinical response to a single agent of cetuximab is limited by MET amplification and overexpression. (a) Time line describing treatments and responses in the case study. Blue indicates a CetuxSen tumor and red indicates a CetuxRes tumor. (b) CT scans fromthe time of disease recurrence (August 2012) and the best response (September 2013). Red arrows indicate lesions. (c) Tumor size (mm2) according to CT scans of the disease recurrence (August 2012) and the best response (September 2013). (d) PET scans from the time of disease recurrence (August 2012) and the first sign of progression under cetuximab treatment (January 2014).
