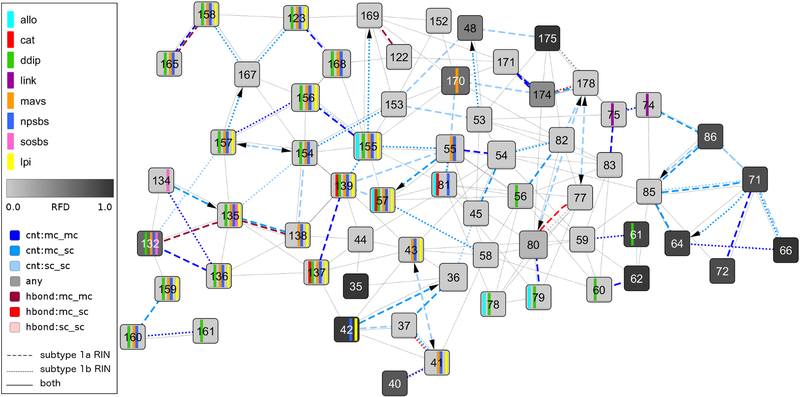
Fig 2. Network comparison view between subtype 1a and 1b consensus residue-interaction networks with focus on functional sites and protease inhibitor resistance-associated sites.
This comparison network view shows the noncovalent residue interactions between a subset of residues of the NS3–4A protease with focus on the differences between subtype 1a and 1b consensus residue-interaction networks. The view focuses on the protease inhibitor (PI) resistance-associated sites 36, 54, 55, 80, 155, 156, 168, and 170 and further includes their direct neighbors, all residues annotated as functionally important (see Materials and Methods), and residues that vary between subtype 1a and 1b. Functional residue annotations are shown as vertical bars (cyan – allosteric site; red - catalytic site; green - domain-domain interaction sites; violet - residues interacting with the linker region; orange - MAVS peptide; blue - natural peptide substrate; yellow - linear PI; purple - SOS-binding site of TRIF). The residue frequency distance is mapped to the node color using a white-to-grey gradient for small-to-large values. Solid edge lines represent noncovalent residue interactions present in both subtype consensus residue-interaction networks, dashed edge lines are residue interactions from the subtype 1a consensus residue-interaction network, and dotted edge lines correspond to residue interactions in the subtype 1b consensus residue-interaction network. Edges that represent contacts are colored in blue, hydrogen bonds in red, and overlaps in grey; a darker color indicates interaction between main chain atoms, while lighter color as well as an arrow stands for side chain atom interactions.

