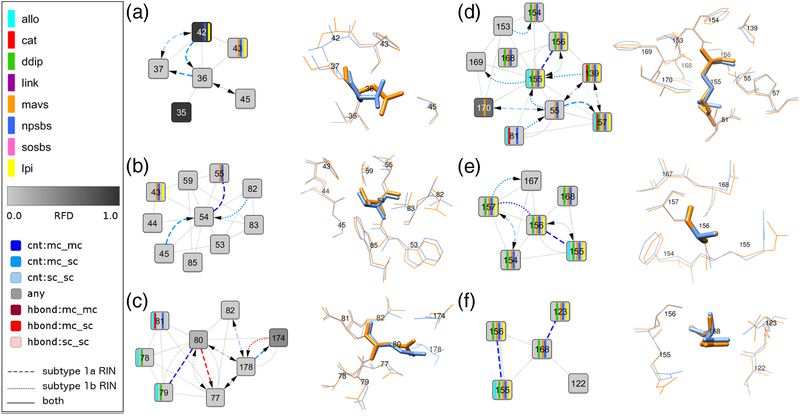
Fig 3. Network comparison view and corresponding 3D structure close-up for the subtype-specific protease inhibitor resistance-associated sites: (A) 36, (B) 54, (C) 80, (D) 155, (E) 156, and (F) 168.
Each comparison network view shows the noncovalent residue interactions between the specified residue and its direct neighbors from the subtype 1a and 1b consensus residue-interaction networks. Node and edge colors as well as functional annotations are described in the graphical legend above and in the Fig 2 legend. The corresponding residues from the subtype 1a reference structure from Protein Data Bank entry 2OBQ and the subtype 1b reference structure from Protein Data Bank entry 1DXP are aligned and shown as blue and orange sticks, respectively.

