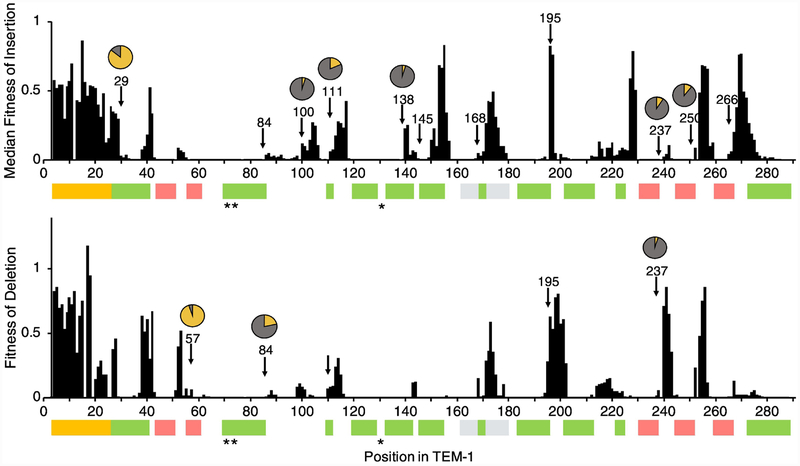
Fig. 2. Fitness of TEM-1 containing InDels as a function of primary sequence.
Median fitness values are presented for insertions. Arrows indicate positions at which other class A β-lactamases contain an insertion or deletion (based on a multiple sequence alignment of 156 class A β-lactamase and TEM-1). Pie charts indicate in yellow the fraction of sequences out of 156 that contain an insertion (top chart) or deletion (bottom chart) at that position. Pie charts are omitted for fractions less than 3%. The colored bars indicate the signal sequence (yellow), α helices (green), β strands (pink), Ωloop (grey), and active sites (*).

