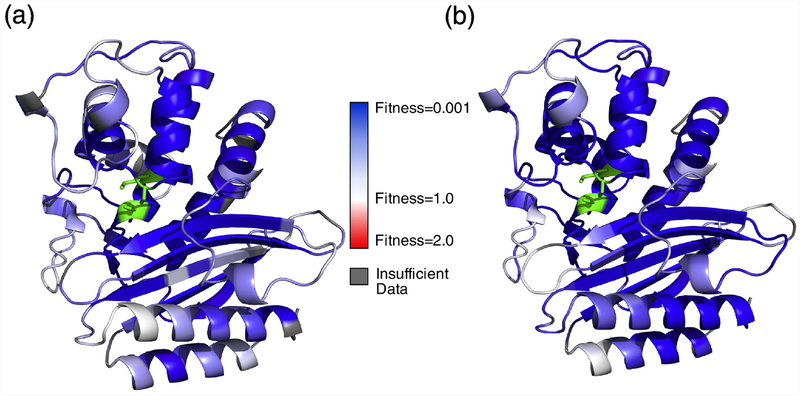
Fig. 3. InDel fitness mapped onto TEM-1 structure.
(a) TEM-1 secondary structure colored by median fitness of insertions. Positions for which we obtained fewer than 4 fitness values are indicated in grey. (b) TEM-1 secondary structure colored by fitness of deletions. In both figures, the active site residues are colored in green. No mean fitness values > 1 are observed.

