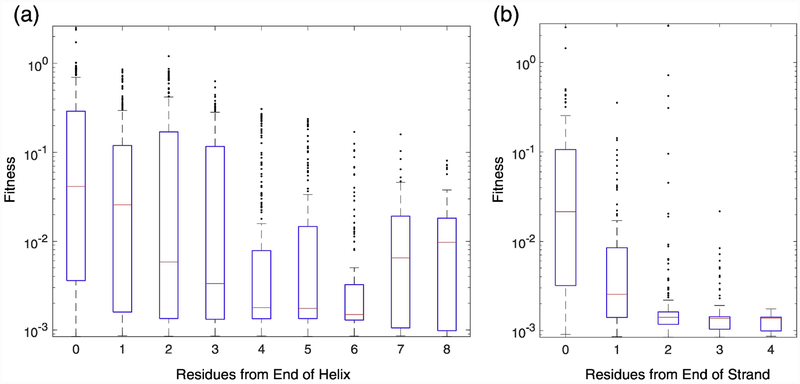
Fig. 5. Relationship between insertion fitness and distance from the closest end of secondary structure element.
(a) Box plots of fitness values for insertions within helices. (b) Box plots of fitness values for insertions within strands. The number 0 corresponds to insertions immediately before or immediately after the structure element, the number 1 refers to insertions after the first or before the last residue in the structure element, and so on.

