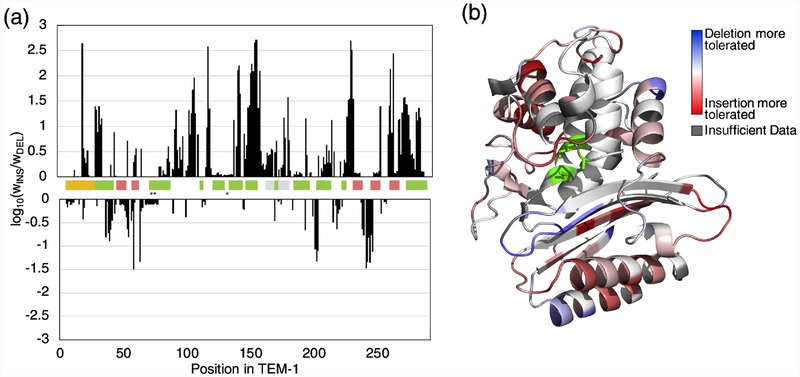
Fig. 6. Differences in tolerance to insertions and deletions across TEM-1.
(a) The log10 of the ratio between mean fitness of insertions and the fitness of a deletion at each position across TEM-1. The colored bars indicate the signal sequence (yellow), αhelices (green), β strands (pink), Ω loop (grey), and active sites (*). (b) TEM-1 structure colored by the same ratio values. Blue indicates positions with higher tolerance to deletions, white indicates the same tolerance to both insertions and deletions, and red indicated higher tolerance to insertions.

