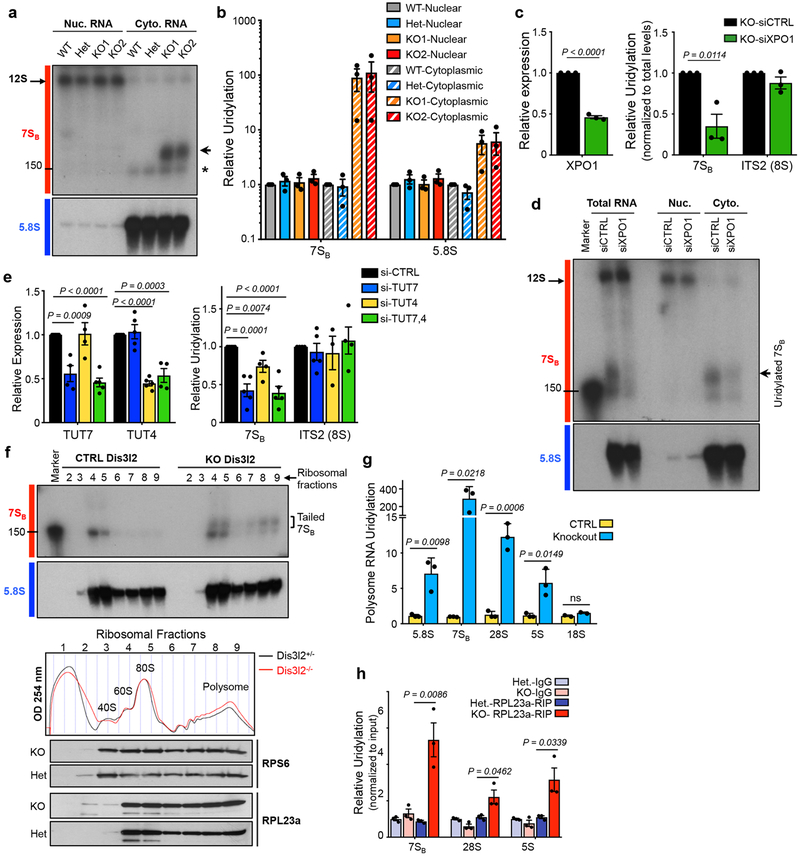
Fig. 2. 7SB rRNA export and cytoplasmic uridylation.
(a) Northern blot analysis of nuclear (Nuc.) and cytoplasmic (Cyto.) fractions with indicated probes. Arrow points to uridylated 7SB and asterisk marks 5.8S rRNA. (b) qRT-PCR analysis of relative uridylation of 7SB and 5.8S rRNAs in the cytoplasmic fraction of knockout mESCs as depicted in Fig. 1a. Bars represent mean ± SEM. Individual P values are presented; two-tailed Student’s t-test (n=3 biologically independent cell cultures). (c) qRT-PCR analysis of XPO1 expression (left panel) and relative uridylation levels of 7SB and ITS2 (8S) (right panel). Bars represent mean ± SEM. Individual P values are presented; two-tailed Student’s t-test (n=3 biologically independent cell cultures). (d) Northern blot analysis with 7SB and 5.8S rRNA probes in indicated fractions from Dis3l2 knockout cells. (e) Left panel: TUT7 and TUT4 levels measured by qRT-PCR in Dis3l2 knockout cells expressing individual siRNAs against TUT4 or TUT7, or a combination of both. Right panel: Relative uridylation of 7SB and ITS2 (8S) rRNAs measured by qRT-PCR after TUT4 and TUT7 knockdown. Bars represent mean ± SEM. Individual P values are presented; two-tailed Student’s t-test (n=4 biologically independent cell cultures). (f) Upper panels: Northern blot analysis of 7SB and 5.8S rRNAs in ribosomal fractions from lysates resolved through 10–50% sucrose gradients. Tailed 7SB in monosome and also in polysome fractions of knockout mESCs are marked by square bracket. Middle panel: Absorbance profiles at 254 nm (OD 254) recorded during fractionation through sucrose gradients. Ribosomal fractions: approximate positions of collected fractions. Lower panels: WB analysis of large (RPL23a) and small (RPS6) subunits protein components of ribosomes in corresponding ribosome fractions. (g) qRT-PCR analysis of uridylated rRNAs in the polysome fraction of Dis3l2 knockout cells. Bars represent mean ± SEM. Individual P values are presented; two-tailed Student’s t-test (n=3 biologically independent cell cultures). (h) Enrichment of uridylated rRNAs in RPL23a-immunoprecipitated samples in Dis3l2 knockout samples. Bars represent mean ± SEM. Individual P values are presented; two-tailed Student’s t-test (n=3 biologically independent cell cultures). To measure the uridylation levels, values were first normalized to Gapdh and then to the total levels of indicated transcript. All the other qRT-PCRs were normalized to Gapdh. WT, ; Het, heterozygote; KO, knockout. Panels a, d, and f are representative images from at least 2 repeats. Uncropped blot/gel images are shown in Supplementary Data Set 1. Source data for panels b, c, e-h are available online.

