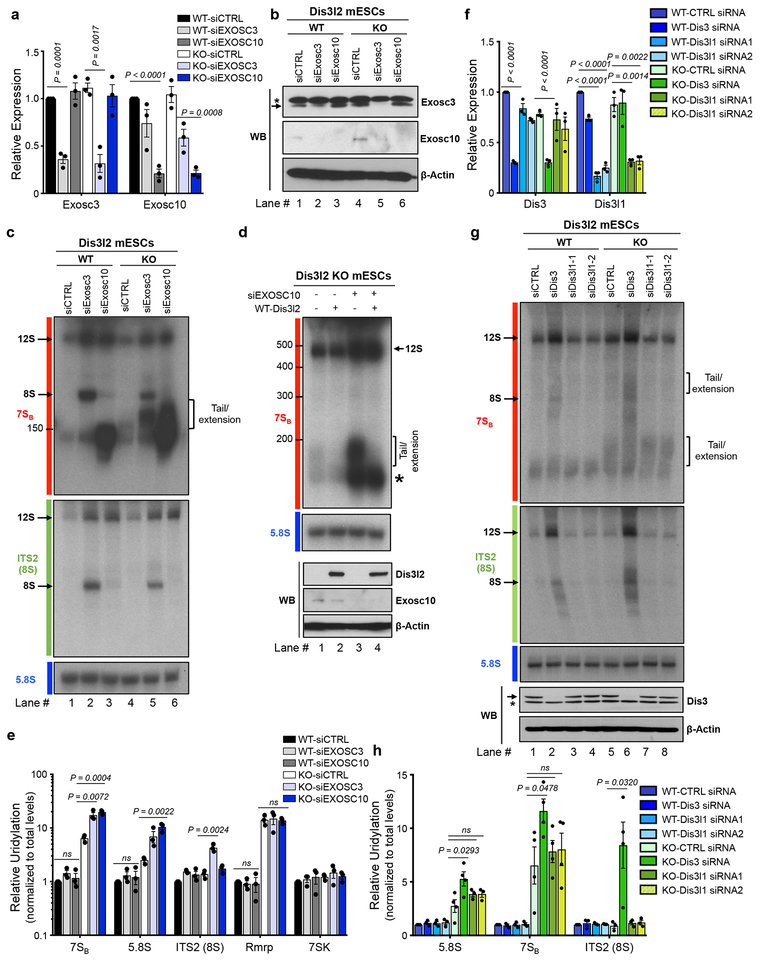
Fig. 3. Dis3l2-mediated rRNA processing and its relationship with the exosome.
qRT-PCR (a) and western blot (b) analysis of Exosc3 and Exosc10 expression in Dis3l2 wild type (WT) and knockout (KO) cells after siRNA transfection. In (a), bars represent mean ± SEM. Individual P values are presented; two-tailed Student’s t-test (n=3 biologically independent cell cultures). In (b), asterisk represent an unspecific band, whereas the arrow points to Exosc3 band. (c) Northern blot analysis of total RNAs from WT and Dis3l2 knockout ESCs depleted of Exosc3 or Exosc10 with 7SB, ITS2 and 5.8S rRNA probes. Arrows mark discrete bands of 12S and 8S rRNAs. The square bracket represents slow migrating tailed rRNAs. (d) Upper panel: Northern blot for 7SB rRNA in Dis3l2 knockout cells after Exosc10 knockdown and/or re-expression of WT Dis3l2. Lower panel: WB analysis of Exosc10 and Dis3l2 (FLAG-tagged) expression. (e) qRT-PCRs quantifying the relative uridylation of RNAs in samples treated as in (c); 7SK and Rmrp RNAs were assessed as negative controls. Bars represent mean ± SEM. Individual P values are presented; two-tailed Student’s t-test (n=3 biologically independent cell cultures). (f) qRT-PCR on control and Dis3- or Dis3l1-knockdown samples. Bars represent mean ± SEM. Individual P values are presented; two-tailed Student’s t-test (n=3 biologically independent cell cultures). (g) Upper and middle panels: Northern blot analysis of WT and Dis3l2 knockout ESCs after depletion of Dis3, or Dis3l1 using specific siRNAs with probes against 7SBor ITS2 (8S), respectively. Lower panel: Western blot analysis of Dis3 in respective samples. Asterisk represents an unspecific band. (h) qRT-PCR analysis of relative uridylation in respective RNA samples from (g). Bars represent mean ± SEM. Individual P values are presented; two-tailed Student’s t-test (n=4 biologically independent cell cultures).To measure relative uridylation levels, values were first normalized to Gapdh and then to the total levels of indicated transcript. WT, wild type Dis3l2; KO, knockout Dis3l2; ns, not significant. Panels b, c, d, and g are representative images from at least 3 repeats. Uncropped blot/gel images are shown in Supplementary Data Set 1. Source Data for panels a, e, f and h are available online.

