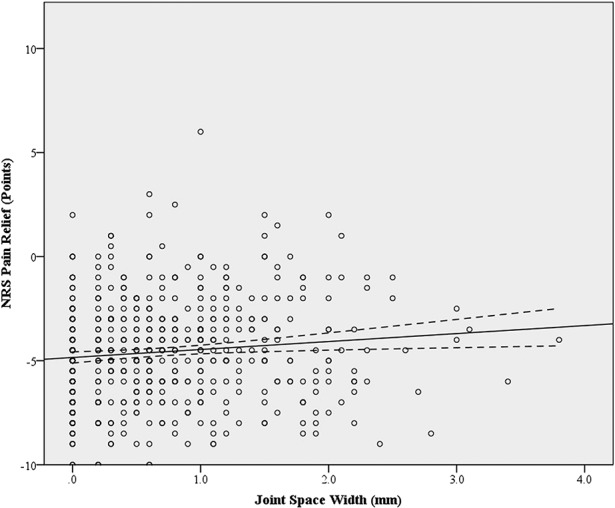
Fig. 3.

Scatterplot displays NRS Pain relief against preoperative joint space width. The dashed line represents the 95% confidence interval for the linear best-fit line. The linear equation for the best-fit line is y = 0.38x – 4.85 (R-squared = 0.012, 95% confidence interval = 0.10–0.67) and demonstrates the relationship between increasing joint space width and decreased pain relief after THA.
