Figure 5.
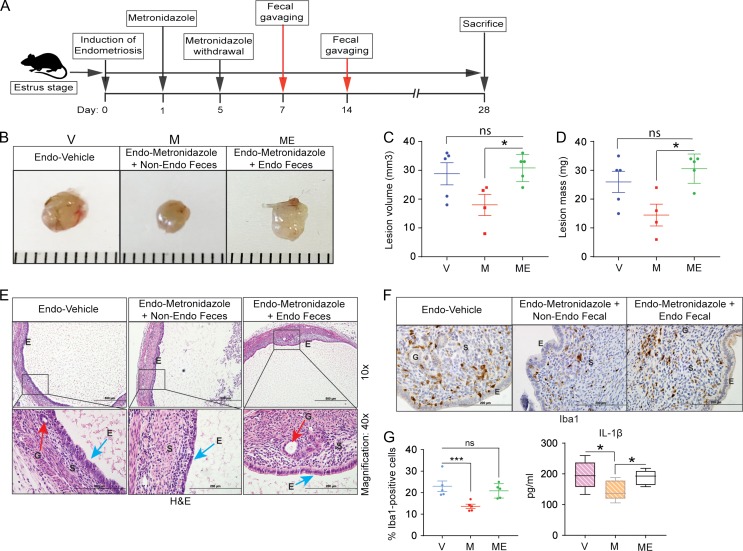
Oral gavage of faeces from endometriotic mice promotes endometriotic lesion growth in antibiotic-treated mice. (A) Schematic of experimental timeline and procedures. (B–D) Representative gross images (B), volumes (C) and masses (D) of ectopic endometriotic lesions from the indicated treatment groups 28 days after surgical induction of endometriosis; ‘V’, ‘M’ and ‘ME’ denote endo-vehicle, endo-metronidazole + non-endo faeces, and endo-metronidazole + endo faeces, respectively; n = 4–5. (E) Representative Hematoxylin and Eosin-stained cross-section images of ectopic lesions from the indicated treatment groups; n = 4–5. Scale bars represent 200 μm (upper panel) and 500 μm (lower panel). (F) Representative cross-sectional images of ectopic lesions stained for Iba1. (G) Quantification of Iba1-positive cells counted in at least five different areas in ectopic lesions and plotted as percent positive cells relative to total cells (left panel) and quantification of IL-1β concentration in peritoneal fluid from the indicated treatment groups (right panel). Data are presented as mean ± SE (n = 4–5). ‘E’, ‘G’ and ‘S’ denote epithelia, glands and stroma, respectively. *P < 0.05, ***P < 0.001, and ns, non-significant.

