Figure 2.
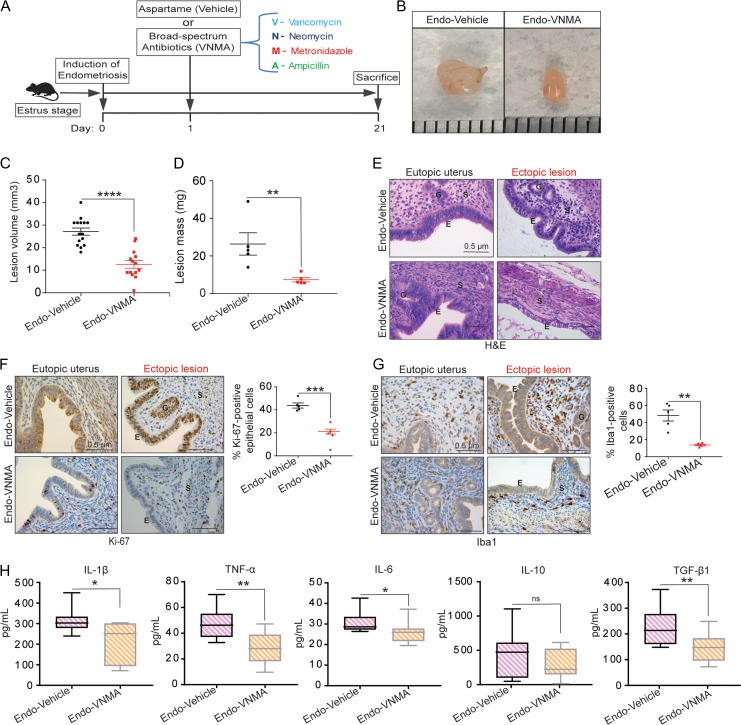
Treatment with broad-spectrum antibiotics reduces endometriotic lesion proliferation and inflammation. (A) Schematic of experimental timeline and procedures. (B–D) Representative gross images (B), volumes (C) and masses (D) of ectopic endometriotic lesions from the indicated treatment groups 21 days after surgical induction of endometriosis. Data are presented as mean ± SE; endo-vehicle (n = 15) and endo-VNMA (n = 14). (E) Representative Hematoxylin and Eosin-stained cross-section images of the eutopic uteri and ectopic lesions from the indicated treatment groups. The scale bar (0.5 μm) applies to all images; n = 5. (F–G) Representative cross-sectional images (left) of the eutopic uteri and ectopic lesions stained for Ki-67 (F) and Iba1 (G); respective graphs on the right show positively stained cells counted in at least five different areas in ectopic lesions and plotted as percent positive cells relative to total cells. The scale bar (0.5 μm) applies to all images; n = 5. ‘E’, ‘G’ and ‘S’ denote epithelia, glands and stroma, respectively. (H) ELISA-based quantification of IL-1β, TNF-α, IL-6, IL-10 and TGF-β1 levels in peritoneal fluid from the indicated treatment groups. Data are presented as mean ± SE (n = 5). *P < 0.05, **P < 0.01, ***P < 0.001, ****P < 0.0001 and ns, non-significant.

