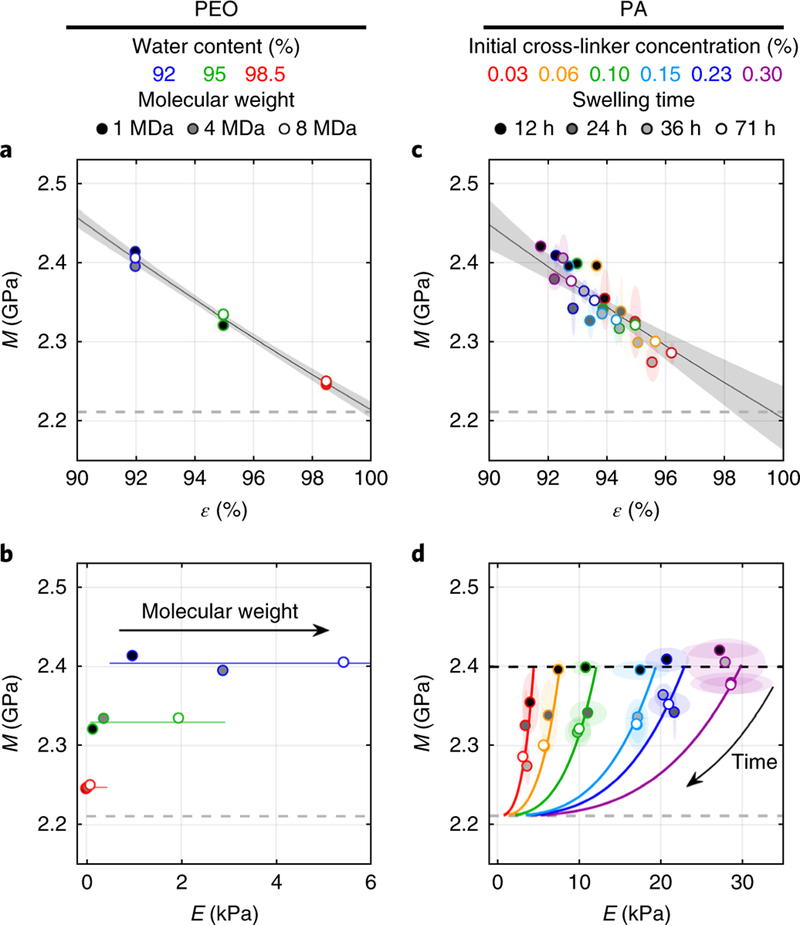
Fig.1. Young’s modulus E, water content ε and longitudinal elastic modulus measured by Brillouin M for polyethylene oxide and polyacrylamide hydrogels.
a, M for PEO of the indicated molecular weight, measured at different ε. The fit to equation (2) is shown (R2 =0.97; one hydrogel per data point).b, M is plotted versus E (color code as in a;one hydrogel per data point). Lines represent values of constant ε. c, M over all swelling times (shading within symbols) and cross-linker concentrations (colored symbols), plotted versus ε for PA. The fit to equation (2) is shown (R2 =0.78; four hydrogels per data point, mean ±2 s. d.).d, Relationships between M and E at various PA hydrogel compositions. Changes in M and E during swelling were consistent with predictions of equations (2) and (3) using Mf =2.21 GPa and Ms =16.35 GPa (curves; four hydrogels per data point, mean ±2 s. d.). Dashed gray lines represent the value of M for pure water. The black dashed line in d represents the estimated initial value of M at the start of swelling when ε0 =0.9 for all hydrogels. Elliptical regions surrounding data points in c and d represent 2 s.d. Shaded regions in a and c represent 95% confidence bounds on the fit by equation (2).

