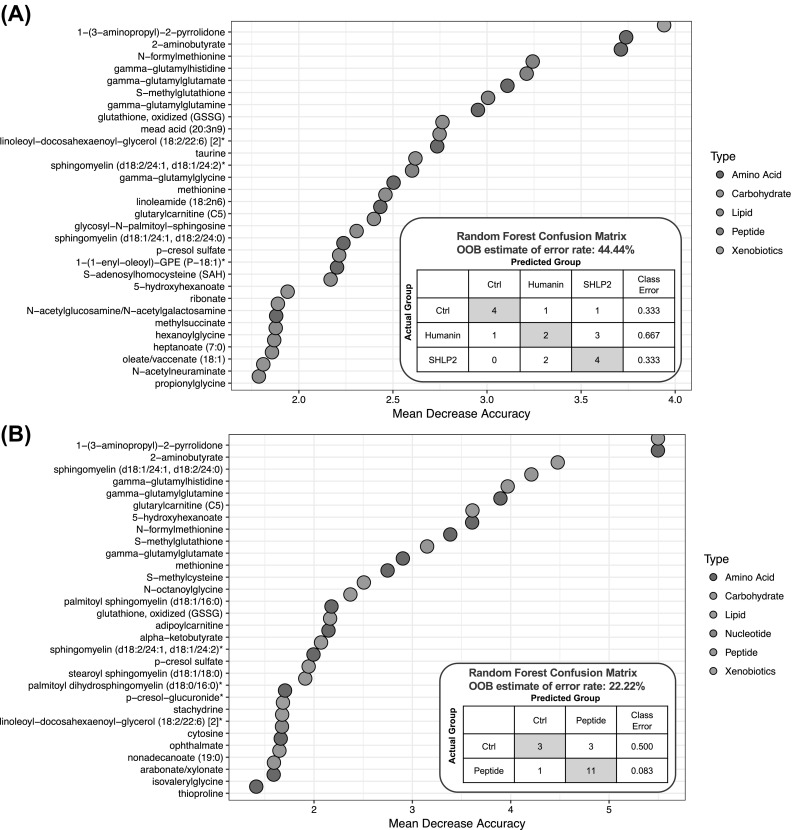
Fig. 2.

Random Forest classification using named metabolites in plasma of control compared to plasma of Humanin and SHLP2 treated mice. The dot chart displays the top 30 Mean Decrease Accuracy values calculated for a the comparison of all three sample groups. A higher Mean Decrease Accuracy value indicates a greater group differentiating contribution. Amino acid and lipid metabolites were highly represented in the top 30. b The comparison between control group and peptide treatment group (Humanin and SHLP2)
