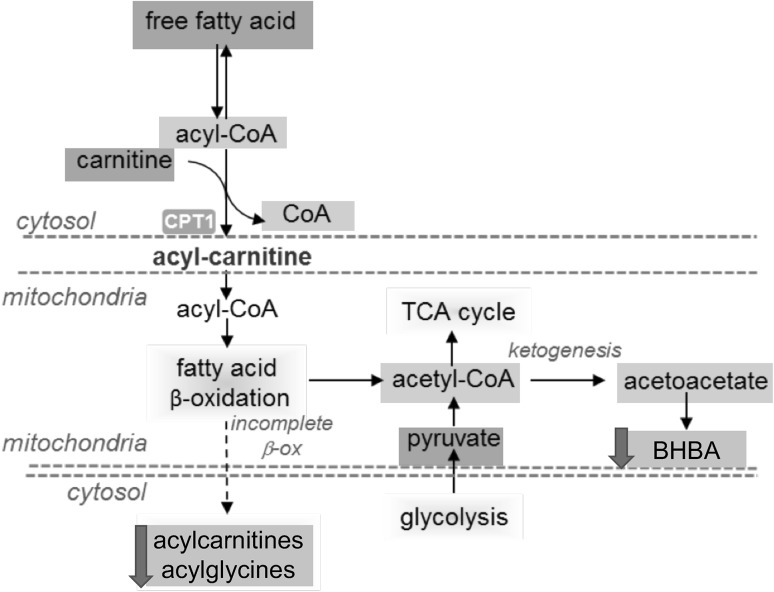
Fig. 6.
The metabolite profile of the carnitine metabolism pathway. The schematic diagram of the pathway. Yellow box indicates metabolite not measured in the metabolomic discovery, green box indicates metabolite measured but did not change in response to peptide treatment, blue box indicates metabolite that was down-regulated compared to control

