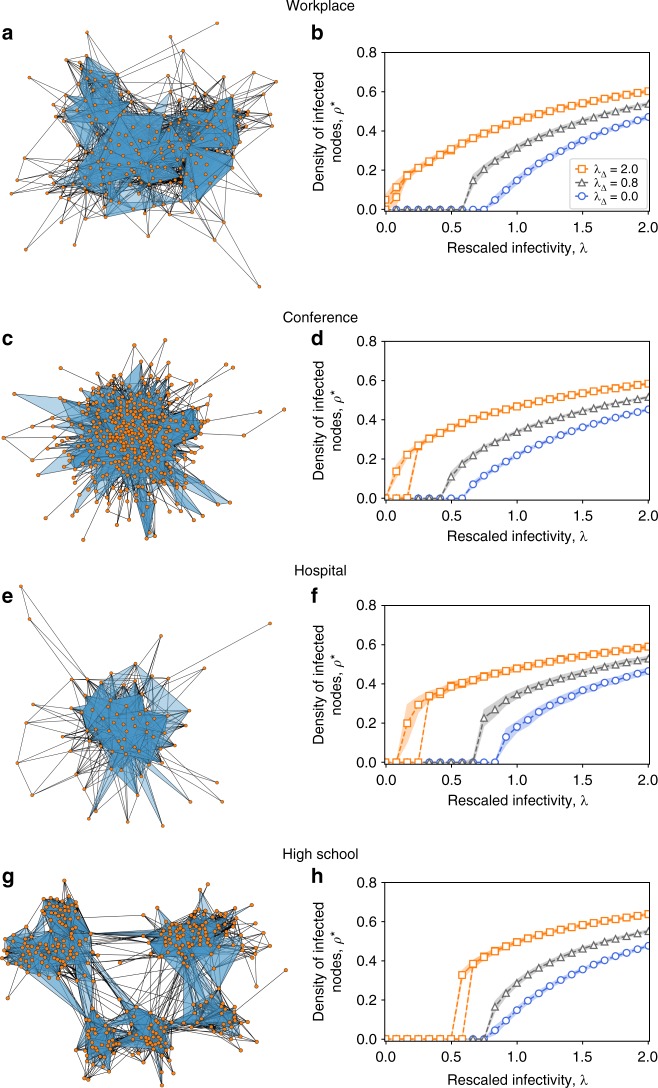
Fig. 2.
SCM of order D = 2 on real-world higher-order social structures. Simplicial complexes are constructed from high-resolution face-to-face contact data recorded in four different context: a a workplace, c a conference, e a hospital and g a high school. Prevalence curves are respectively reported in panels b, d, f and h, in which the average fraction of infectious nodes obtained in the numerical simulations is plotted against the rescaled infectivity λ = β〈k〉/μ for different values of the rescaled parameter λΔ = βΔ〈kΔ〉/μ, namely λΔ = 0.8 (black triangles) and λΔ = 2 (orange squares). The blue circles denote the simulated curve for the equivalent standard SIS model (λΔ = 0), which does not consider higher-order effects. For λΔ = 2 a bistable region appears, where healthy and endemic states co-exist

