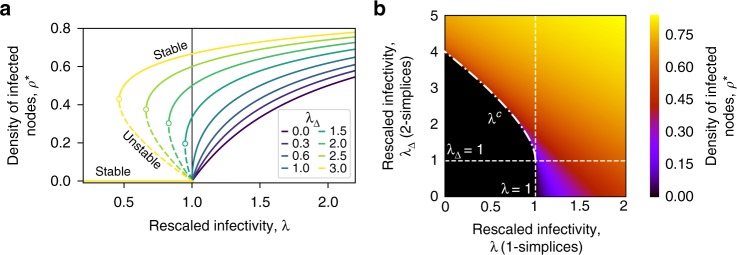
Fig. 4.
Phase diagram of the SCM of order D = 2 in mean field approximation. a The stationary solutions ρ* given by Eq. (4) are plotted as a function of the rescaled link infectivity λ = β〈k〉/μ. Different curves correspond to different values of the triangle infectivity λΔ = βΔ〈kΔ〉/μ. Continuous and dashed lines correspond to stable and unstable branches respectively, while the vertical line denotes the epidemic threshold λc = 1 in the standard SIS model that does not consider higher-order effects. For λΔ ≤ 1 the higher-order interactions only contribute to an increase in the density of infected individuals in the endemic state, while they leave the threshold unchanged. Conversely, when λΔ > 1 we observe a shift of the epidemic threshold, and a change in the type of transition, which becomes discontinuous. b Heatmap of the stationary solution ρ* given by Eq. (4) as a function of the rescaled infectivities λ = β〈k〉/μ and λΔ = βΔ〈kΔ〉/μ. The black area corresponds to the values of (λ, λΔ) such that the only stable solution is . The dashed vertical line corresponds to λ = 1, the epidemic threshold of the standard SIS model without higher-order effects. The dash-dotted line represents the points (λc, λΔ), with , where the system undergoes a discontinuous transition

