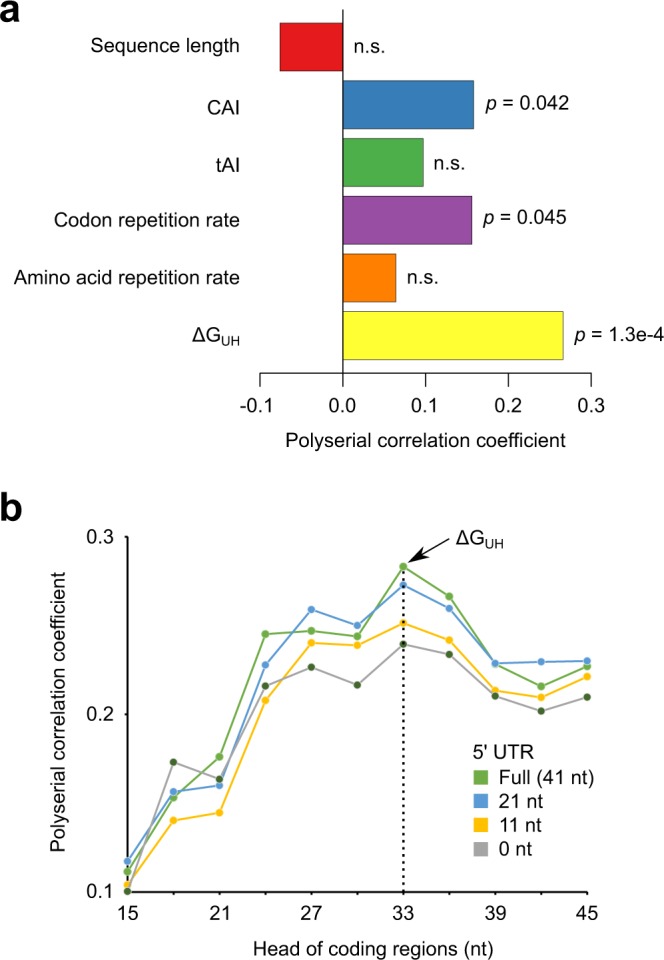
Figure 1.

Influence of sequence features on protein expression levels. (a) For each type of sequence feature, a polyserial correlation coefficient between feature values and expression levels is shown with its p-value. The ΔGUH gave the largest correlation coefficient, meaning that higher ΔGUH (weaker mRNA secondary structures at 5′ regions) associate with higher expression levels. n.s.: p > 0.05. (b) The polyserial correlation coefficients for mRNA folding energies are shown using the different lengths of subsequences in 5′ UTR and the head coding region. The largest correlation coefficient was obtained when the full-length 5′ UTR and 33 head nucleotides were used, which is equivalent to ΔGUH in (a).
