
FIGURE 3.
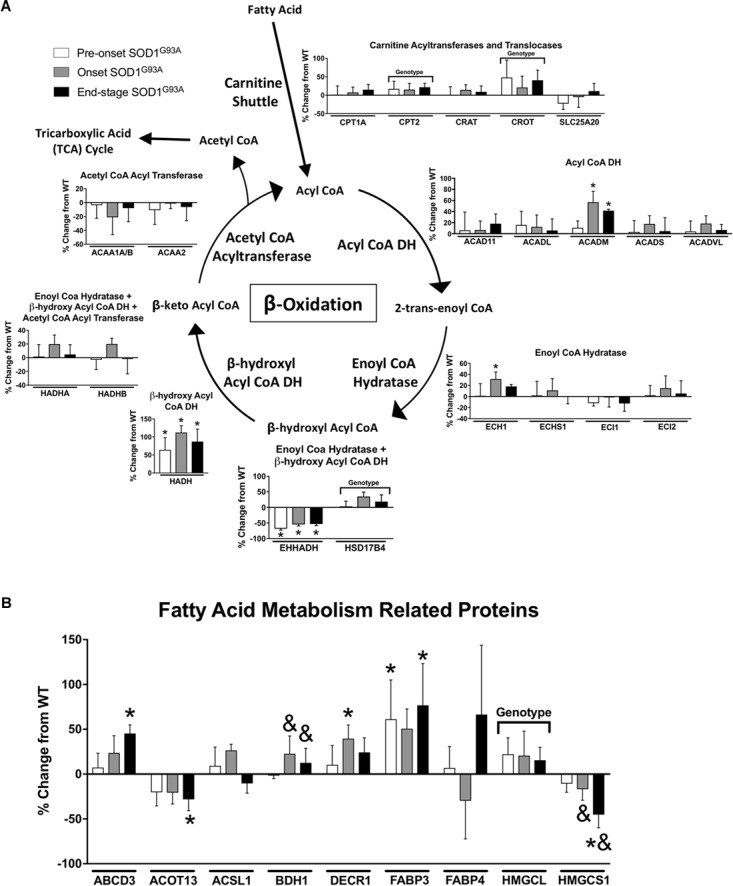
Fatty acid metabolism. Changes in protein content of fatty acid metabolism in SOD1G93A spinal cords compared to controls measured by mass spectrometry (n = 5–6). (A) β-oxidation. (B) Fatty acid metabolism related proteins. Data are represented as percent change relative to the same time point wild-type control. Bars represent means ± standard deviation. “Genotype” denotes a significant genotype effect in Benjamini-Hochberg corrected two-way ANOVA with p < 0.05 but no individual Multiple Comparison test was significant. Significance symbols demonstrate p < 0.05 for a genotype effect and additional significant results for the Tukey Multiple Comparison test. ∗p < 0.05 wild-type vs. SOD1G93A at the designated time point; &p < 0.05 vs. SOD1G93A pre-onset. SOD1G93A pre-onset (white), SOD1G93A onset (gray), SOD1G93A end-stage (black). DH, dehydrogenase; CoA, coenzyme A. Protein names, IDs, and absolute expression values are detailed in Supplemental Table 1.