Fig. 1.
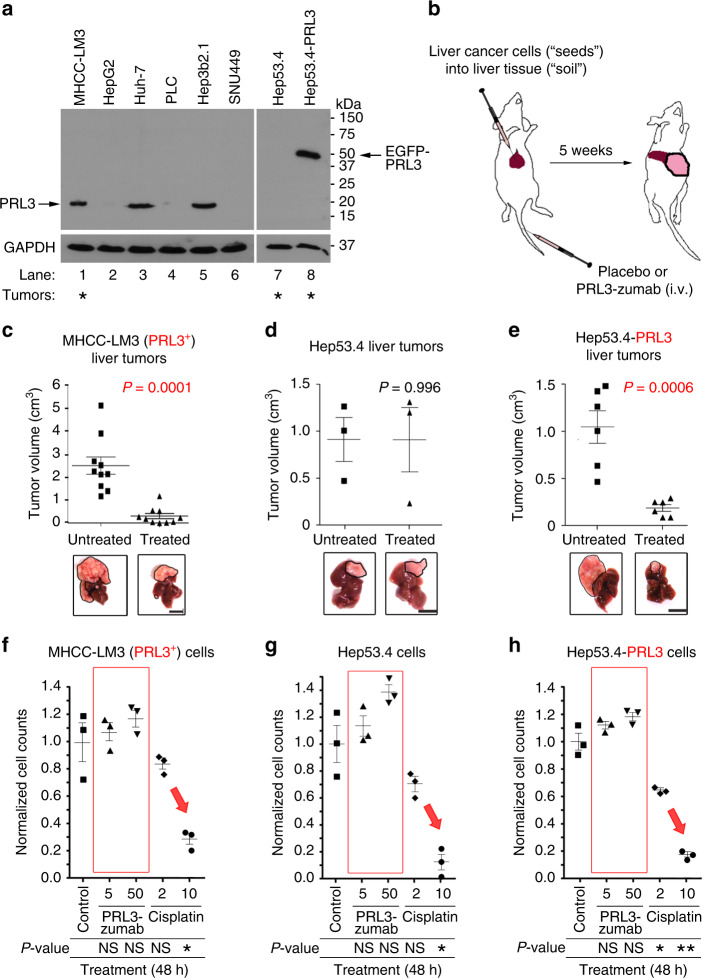
PRL3-zumab inhibits PRL3+ liver tumors in vivo but not cancer cells in vitro. a Representative western blot (WB) of PRL3 protein expression in human (lanes 1–6) and murine (lanes 7 and 8) liver cancer cells. Glyceraldehyde 3-phosphate dehydrogenase (GAPDH) served as a loading control. Asterisks indicate cell lines that rapidly generate orthotopic liver tumors within 5 weeks. b Outline of orthotopic “seed and soil” liver tumor model for treatments. c–e Mean volumes at the end of the experiment in treated (filled squares) and untreated (filled triangles) groups of mice bearing PRL3+ MHCC-LM3 tumors (n = 10 mice per group; c), PRL3− Hep53.4 tumors (n = 3 mice per group; d), and Hep53.4-PRL3 tumors (n = 6 mice per group; e). The mean value was calculated by the Student’s t test (mean ± s.e.m.). P values between treatment pairs as indicated. Lower panels, representative liver tumors at the end of experiment. Scale bar, 10 mm. f–h The viabilities of MHCC-LM3 cells (f), Hep53.4 cells (g), and Hep53.4-PRL3 cells (h) cultured for 48 h with PBS control (filled squares), 5 µg mL−1 PRL3-zumab (filled upright triangles), 50 µg mL−1 PRL3-zumab (filled inverted triangles), 2 µg mL−1 cisplatin (filled diamonds), or 10 µg mL−1 cisplatin (filled circles) were evaluated by an MTS (3-(4,5-dimethylthiazol-2-yl)−5-(3-carboxymethoxyphenyl)−2-(4-sulfophenyl)-2H-tetrazolium) assay. The mean value was calculated by the Student’s t test (mean ± s.e.m., n = 3 biologically independent samples each). *P < 0.05, **P < 0.01, NS, not significant, as compared between treatment and control group for each cell line. Source data are provided as a Source Data file

