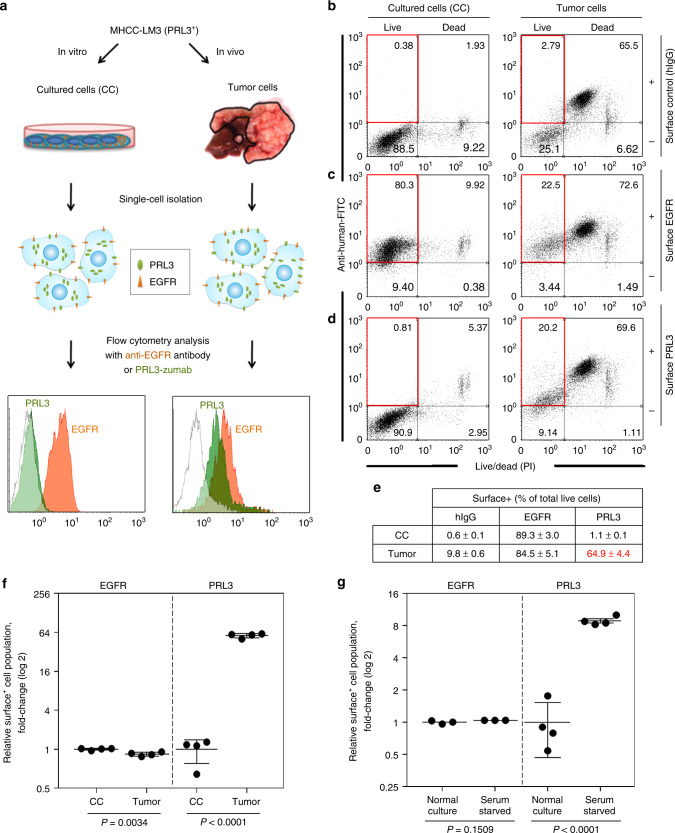
Fig. 2.
Intracellular PRL3 is externalized for PRL3-zumab binding. a Methodology for cell surface analysis of MHCC-LM3 cultured cells (CC) and tumor cells. b–d “Surface” detection of nonspecific control antigens (b), EGFR (c), or PRL3 (d) were detected by fluorescence-activated cell sorting (FACS) analysis using polyclonal human hIgG, anti-EGFR antibody (cetuximab), or anti-PRL3 antibody (PRL3-zumab), respectively. Representative FACS profiles from four biological replicates are shown. e Mean percentage ± s.d. of surface positive (surface+) live cells for each antigen were calculated by dividing the surface antigen-positive live cells (upper left quadrant) by total live cells (sum of both upper and lower left quadrants) in b–d. f Background-corrected values from e were normalized to CC surface expression levels for EGFR (filled circles) and PRL3 (filled squares). The mean fold change was calculated by the Student’s t test (mean ± s.d., n = 4 biologically independent samples). P values as indicated for each antigen. g Background-corrected values of MHCC-LM3 cells cultured under “Normal” vs. “Serum-starved” conditions for 72 h were normalized to “Normal” surface+ cell percentages for each antigen. The mean fold-change was calculated by the Student’s t test (mean ± s.d.) for EGFR (filled circles; n = 3 independent samples) and PRL3 (filled squares; n = 4 independent samples). P values as indicated for each antigen. Source data are provided as a Source Data file

