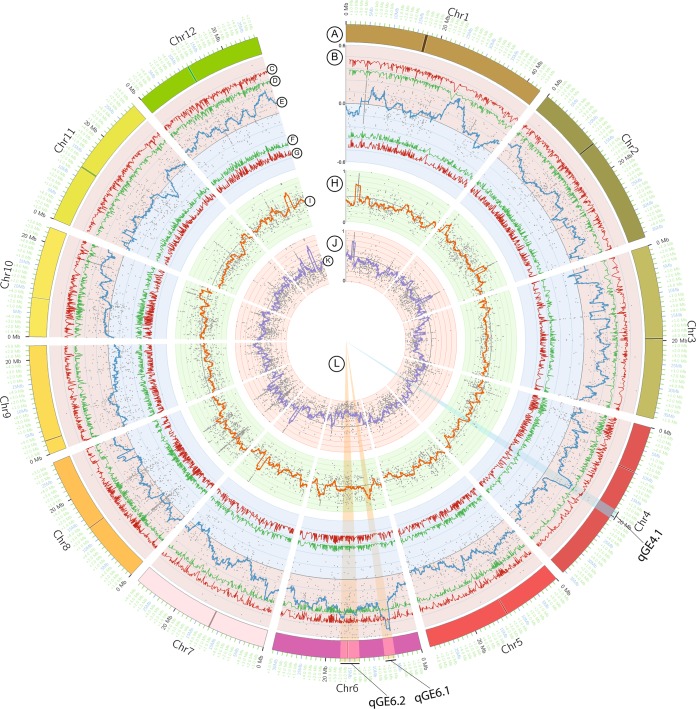
Figure 3.
Plots of SNP index of two bulks (HGE bulk and LGE bulk) and ∆(SNP index) compared between them. (A) Psuedomolecules of Nipponbare reference genome (IRGSP 1.0). (B) Plots of ∆(SNP index) compared between two bulks (HGE bulk and LGE bulk). (C) Upper probability values at 99% confidence (P < 0.01). (D) Upper probability values at 95% confidence (P < 0.05). (E) The sliding window plots of average SNP indexes with a 2-Mb window size and 10-kb steps. (F) Lower probability values at 95% confidence (P < 0.05). (G) Lower probability values at 99% confidence (P < 0.01). (H) SNP index plots of HGE bulk. (I) The sliding window plots of average SNP index values with a 2-Mb window size and 10-kb steps. (J) SNP index plots of LGE bulk. (K) The sliding window plots of average SNP index values with a 2-Mb window size and 10-kb steps. (L) Candidate genomic regions containing QTLs for grain elongation.

